Good Charts That Let Data Speak — DataViz Weekly
July 24th, 2020 by AnyChart Team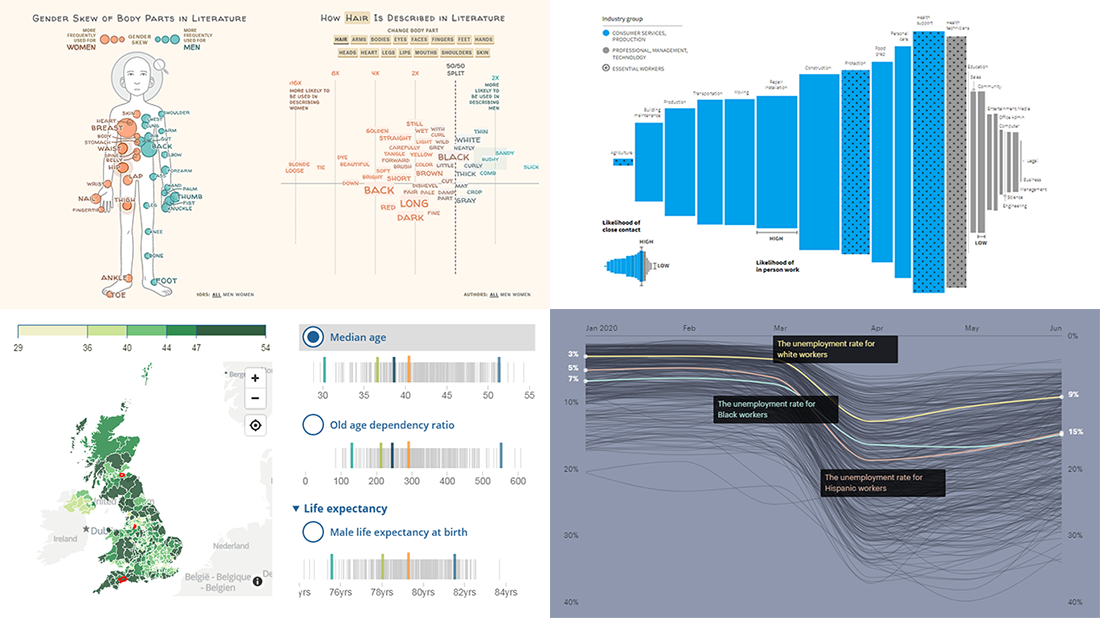 Good charts let data speak, providing insight, revealing patterns and trends, and telling stories. Look at new projects featuring graphics like that, from data visualization professionals!
- Physical traits defining men and women in literature — The Pudding
- Remote work dividing America — Reuters
- Racial disparities in unemployment in America — ProPublica
- Ageing indicators across the United Kingdom — ONS
- Categories: Data Visualization Weekly
- No Comments »
Visualizing Hubble Observations, Census Evolution, Conflicts, and Media Consumption — DataViz Weekly
April 10th, 2020 by AnyChart Team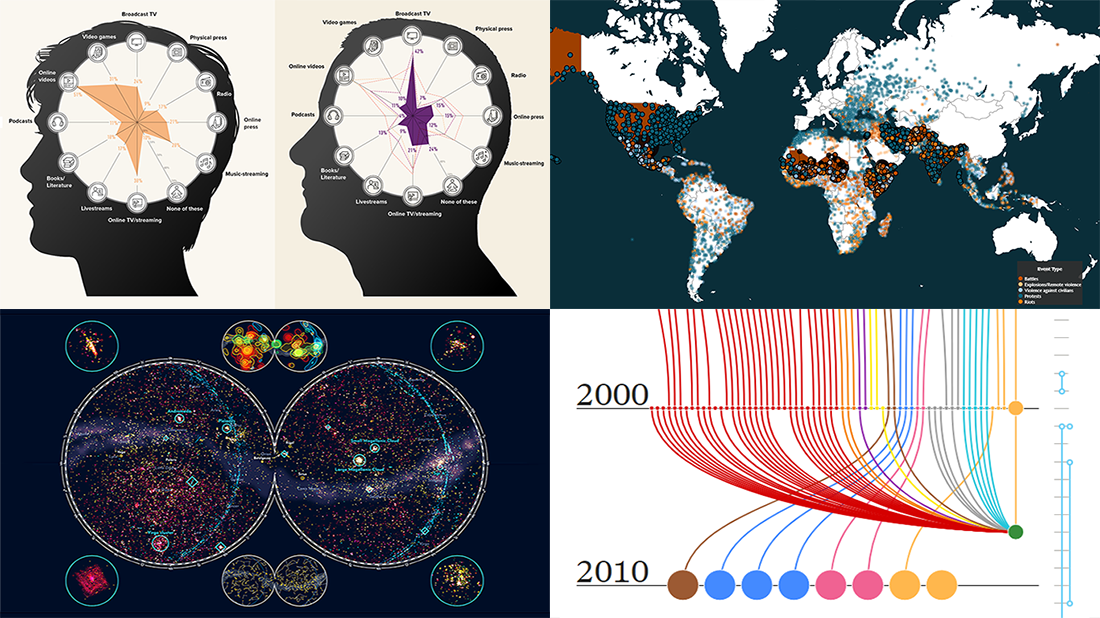 In the new DataViz Weekly post, we are glad to tell you about new compelling visualizations we have come across these days. Here’s what projects made it to our today’s selection, from people’s activities to Hubble observations:
- 30 years of the Hubble Space Telescope’s observations — Physics Today
- Evolution of the U.S. census from 1790 to 2020 — The Pudding
- 10 conflicts to worry about in 2020 — ACLED
- Media consumption during the COVID-19 pandemic — Visual Capitalist
- Categories: Data Visualization Weekly
- No Comments »
Best Charts of 2019 — DataViz Weekly
January 10th, 2020 by AnyChart Team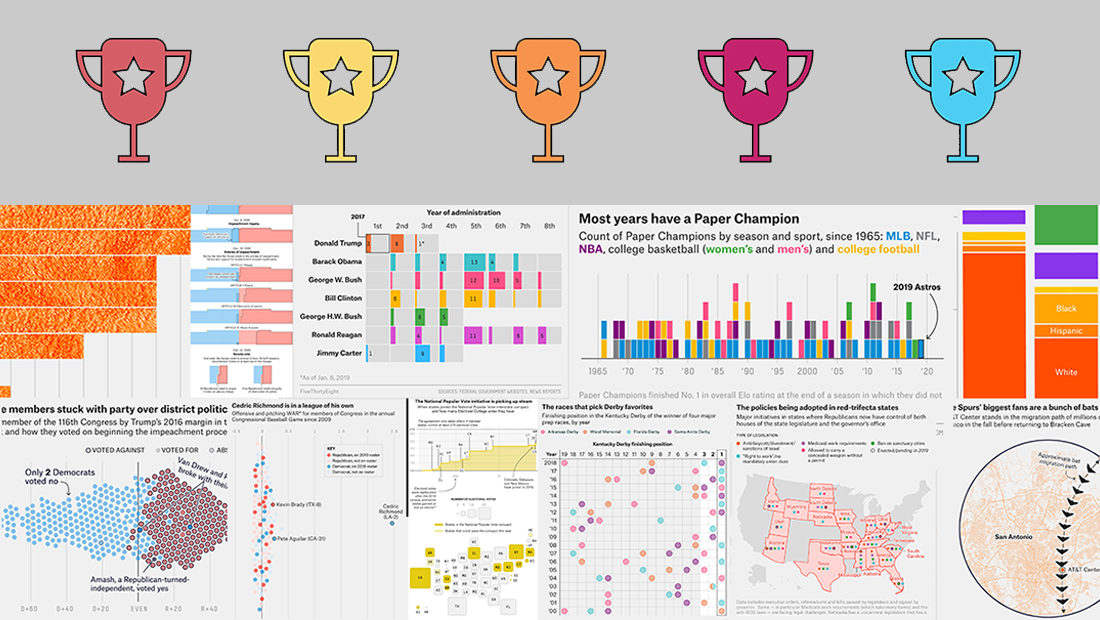 2019 was very fruitful for the world of data visualization. We saw a lot of charts, maps, and infographics on all kinds of topics published here and there. Today we would like to invite you to recall some of the most top-notch data visualization projects. Enjoy these four awesome collections of the best charts of the past year:
- FlowingData’s picks for the best data visualization projects of 2019
- The Pudding’s favorite visual and data-driven stories of 2019 (the Pudding Cup winners)
- FiveThirtyEight’s 56 best (“and weirdest”) charts made in 2019
- Visual Capitalist’s top infographics of 2019
- Categories: Data Visualization Weekly
- 2 Comments »
Readership, NBA, Color, and Christmas Data Visualizations — DataViz Weekly
December 27th, 2019 by AnyChart Team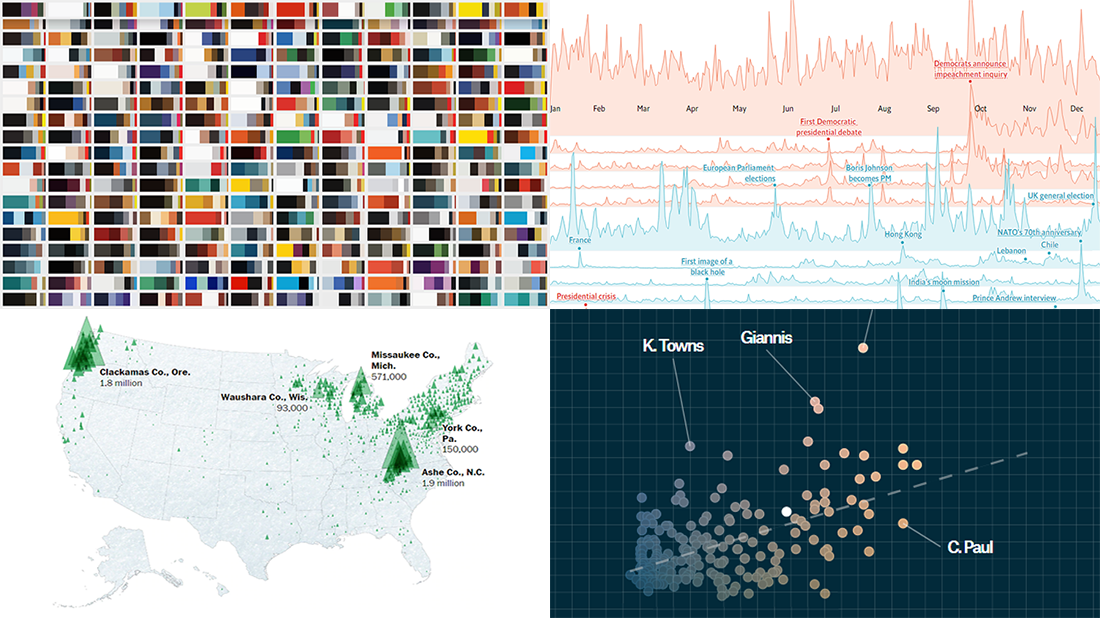 Merry Christmas to all who celebrate it! On the last Friday of 2019, we invite you to check out the year’s last DataViz Weekly article on AnyChart Blog, highlighting some of the most interesting charts published at the end of the year. Of course, we could not help featuring some Christmas data graphics in this festive week. But here you will also learn about projects with cool charts on other subjects. Here’s a list of what the data visualizations shown in today’s DataViz Weekly are about:
- Where American Christmas trees come from — The Washington Post
- Top news stories of 2019 by readership — The Economist
- NBA players’ performance against pay — The Pudding
- Colors on Scientific American’s covers over 175 years of the magazine’s life — Scientific American
- Categories: Data Visualization Weekly
- No Comments »
Visual Data Analysis in Action with Examples on Laugh, DST, Science, and Health — DataViz Weekly
November 8th, 2019 by AnyChart Team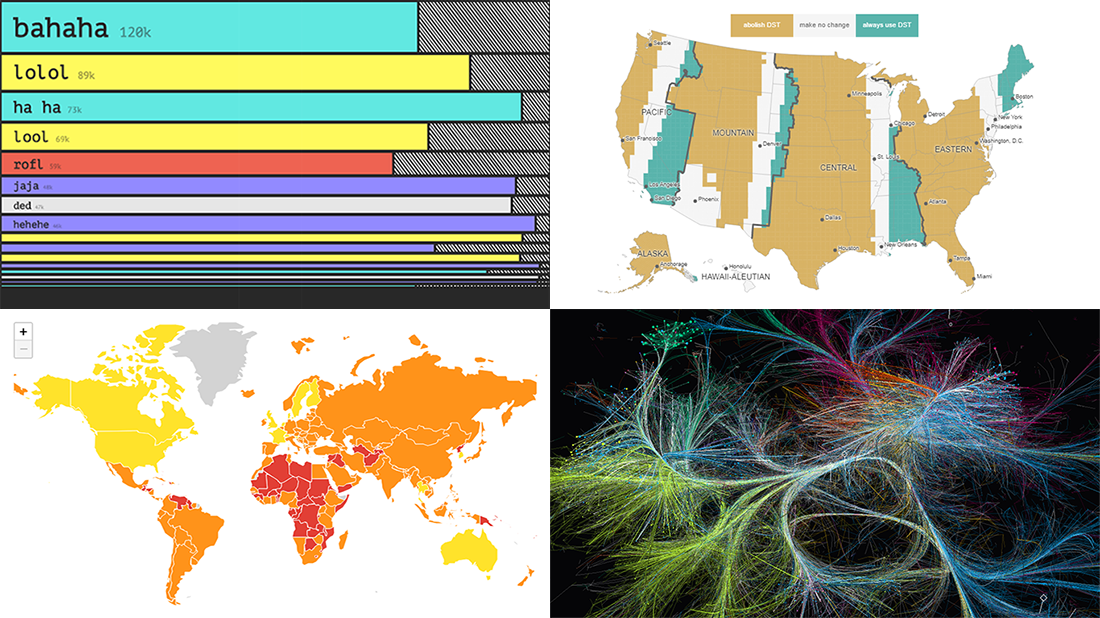 Visual data analysis can be extremely helpful when you need to make sense of large amounts of diverse information. Check out several new striking examples! The four projects in the spotlight of today’s DataViz Weekly roundup have been made public just about now and we are glad to introduce them to you right now:
- Laughing online — The Pudding
- DST gripe assistant tool — Andy Woodruff
- 150 years of papers — Nature
- Global health security — JHU, NTI, and EIU
- Categories: Data Visualization Weekly
- No Comments »
New Data Chart Examples Worth Seeing About Coal, People, Movies, and Migration — DataViz Weekly
May 31st, 2019 by AnyChart Team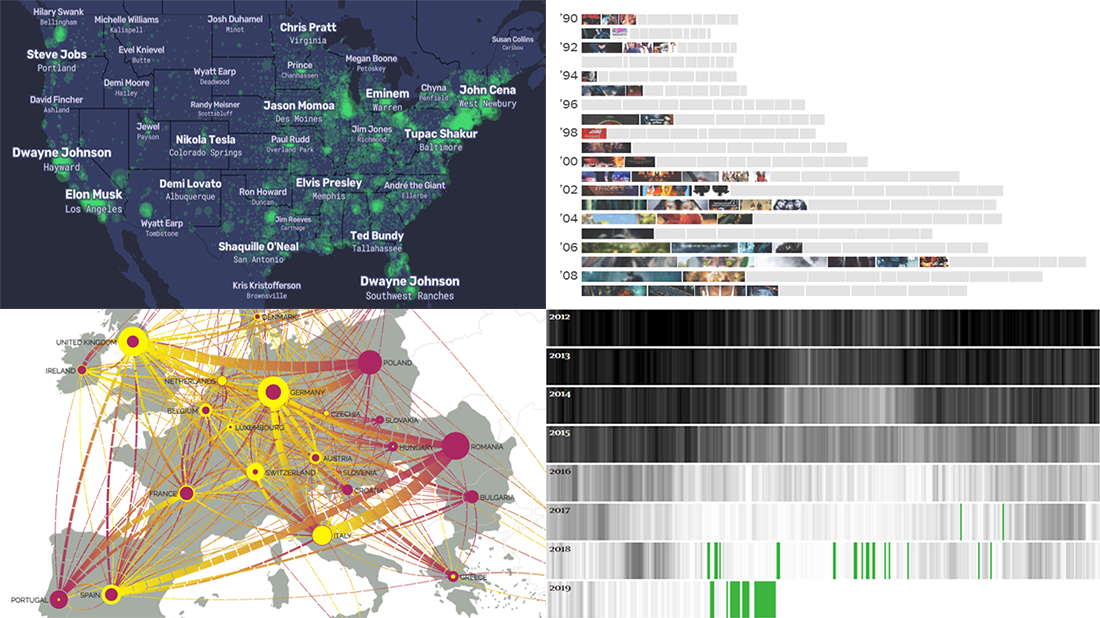 Data visualization is a powerful way to facilitate making sense of numbers. It can provide an insightful look at data and display trends and patterns at a glance for a more efficient and quicker analysis. Check out new data chart examples from around the web that nicely show how it works in practice.
Today on DataViz Weekly:
- How Britain is phasing out coal-powered energy
- U.S. cities’ most Wikipedia’ed residents
- Rise of summer movie sequels
- European migration flow map
- Categories: Data Visualization Weekly
- 1 Comment »
Visual Data Graphics on EU Regions, Freedom of Press, IMF Forecasts, and Climate Change — DataViz Weekly
April 26th, 2019 by AnyChart Team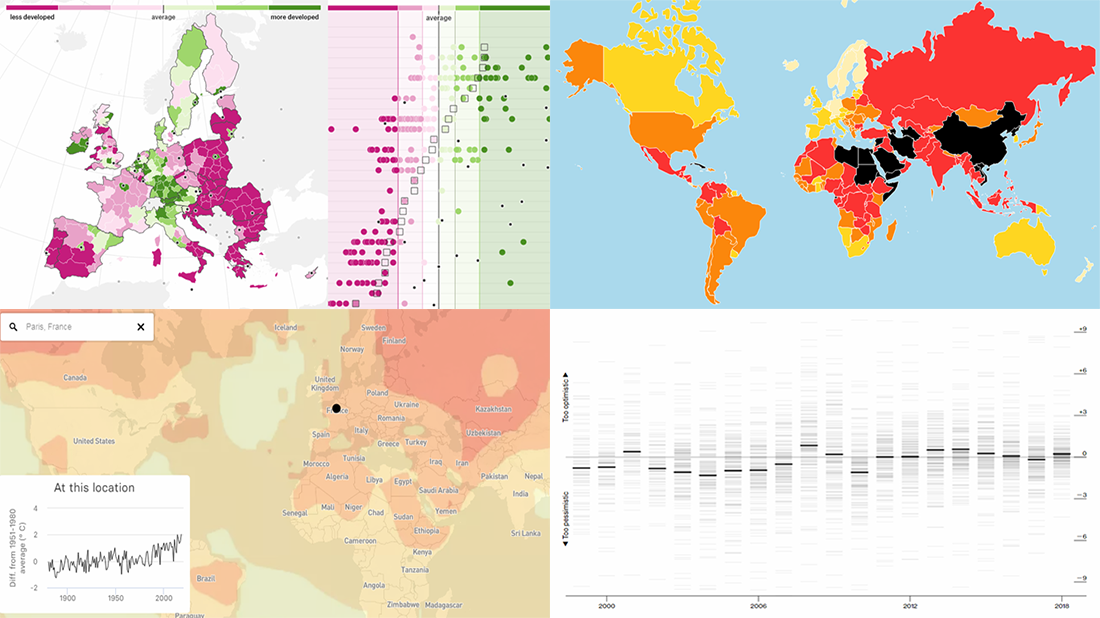 Get ready for another dose of cool visual data graphics — DataViz Weekly is here! Today we are glad to acquaint you with the following new interesting projects:
- The Pudding explains why EU regions redraw their borders.
- Reporters Without Borders shares its annual World Press Freedom Index for 2019.
- Bloomberg analyzes errors in the International Monetary Fund’s spring forecasts of same-year GDP growth.
- BuzzFeed visualizes how climate change has already transformed the planet.
- Categories: Data Visualization Weekly
- No Comments »
New Interesting Data Visualizations on NBA, Spending, and Gender Pay Gap — DataViz Weekly
March 15th, 2019 by AnyChart Team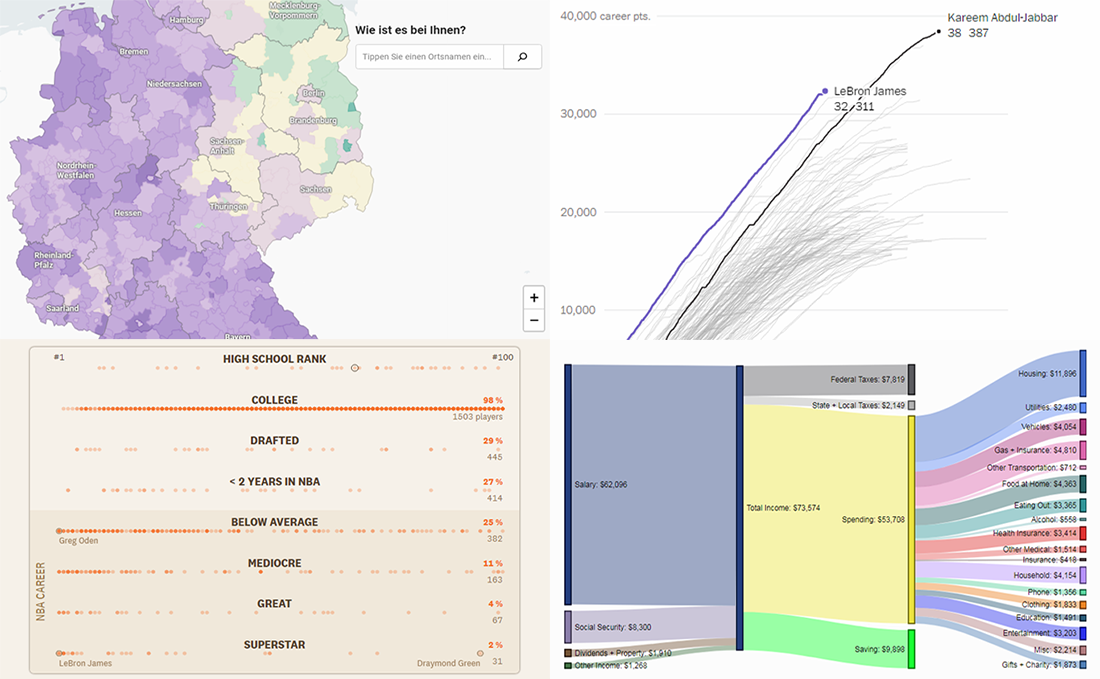 Continuing the regular DataViz Weekly feature on the AnyChart blog, today we are happy to tell you about new interesting data visualizations we’ve found these days — wonderful examples of charts designed for visual storytelling and analytics:
- gender pay gap in Germany;
- NBA’s all-time scoring leaders, now with LeBron James in top 4;
- from leading high school basketball players to NBA superstars;
- household spending in the United States, by income group.
- Categories: Data Visualization Weekly
- No Comments »
New Great Data Visualization Examples on Elevation, Energy, Misspelling, and Jobs — DataViz Weekly
March 1st, 2019 by AnyChart Team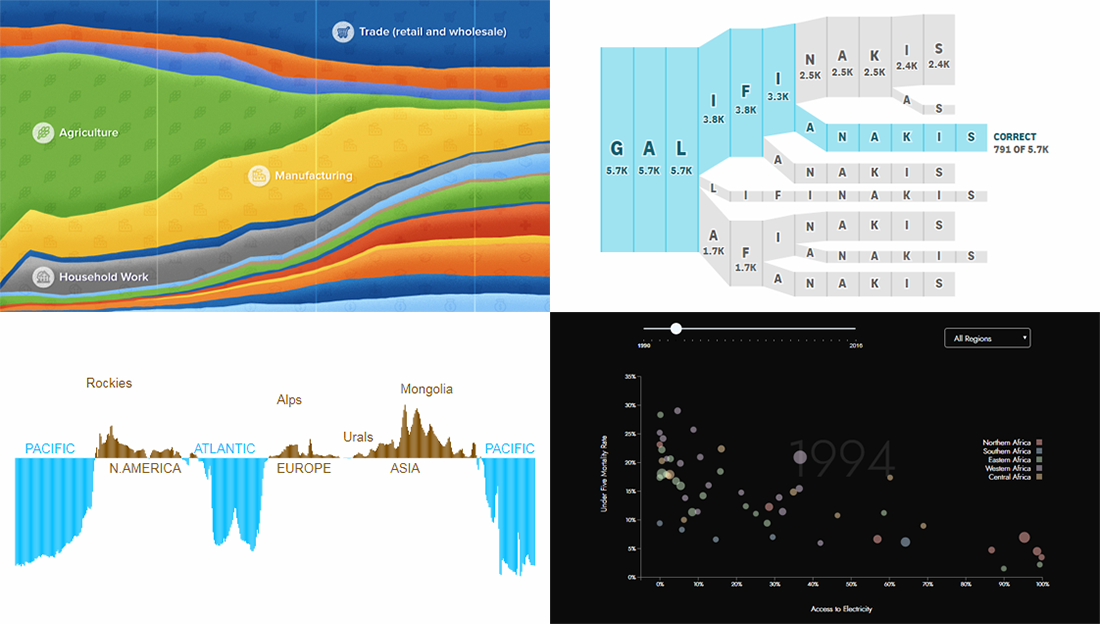 Hey everyone! Check out new great data visualization examples we’ve recently found around the web! The projects we feature today on DataViz Weekly are about Earth’s elevation and ocean depth, renewable energy in Africa, misspellings of celebrity names, and history of employment in the United States.
- Categories: Data Visualization Weekly
- No Comments »
New Visualizations of Data on Subreddits, Voters, Population, and Health — DataViz Weekly
November 2nd, 2018 by AnyChart Team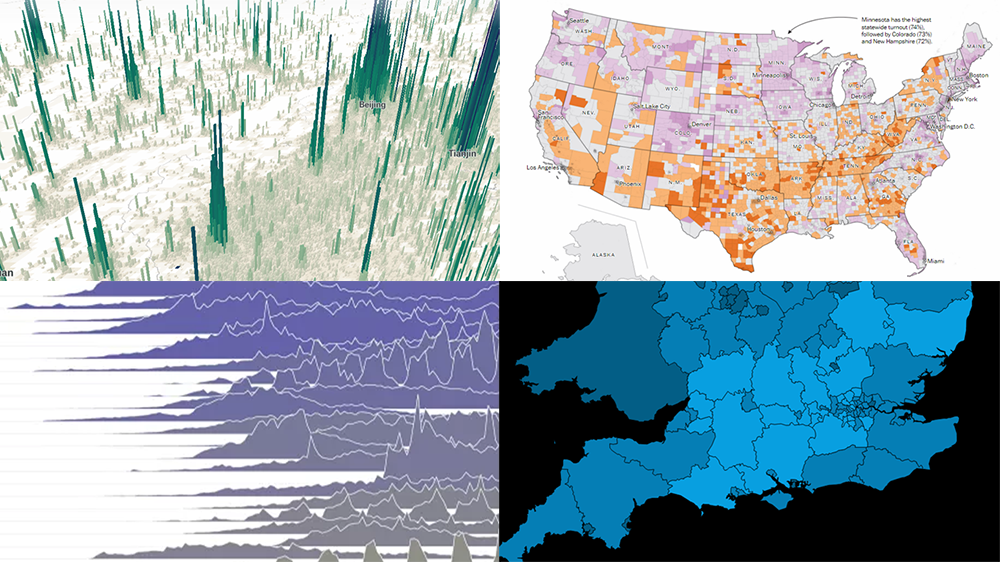 Hey everyone! We’ve gone through a number of new visualizations this week and selected four interesting projects to feature on DataViz Weekly today:
- the most commented subreddits over years;
- voter turnout in the United States;
- population density as terrain;
- years lost to leading death causes across the United Kingdom.
- Categories: Data Visualization Weekly
- No Comments »