How to Build Pie Charts with JavaScript
September 28th, 2023 by Shachee Swadia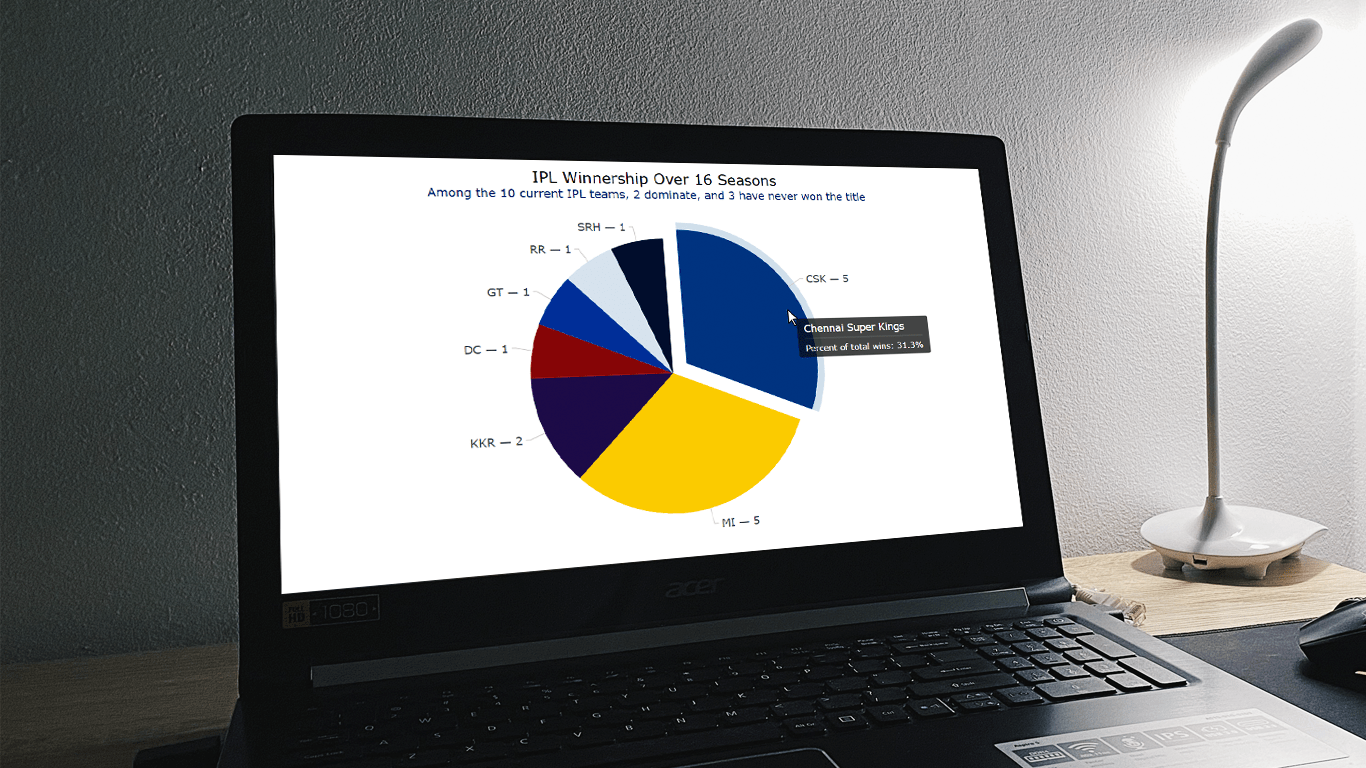 The pie chart, a widely used chart type yet also a topic of debate here and there, has cemented its place in the realm of data visualization. When used appropriately, it provides an intuitive insight into the composition of data, with each slice of the pie representing a distinct component. In this tutorial, I’ll guide you through a straightforward path of creating interactive pie charts using JavaScript.
Every chart begins with data. To demonstrate the concepts in this tutorial, I decided to visualize the composition of the Indian Premier League (IPL) winnership over its 16-season history.
Whether you’re a novice or an experienced coder, get ready to immediately acquire the valuable skills of crafting visually appealing JS-based pie charts from scratch.
Read the JS charting tutorial »
- Categories: AnyChart Charting Component, HTML5, JavaScript, JavaScript Chart Tutorials, Tips and Tricks
- No Comments »
Elevated Data Control & Customization in AnyChart’s Latest Qlik Sense Extensions
September 12th, 2023 by AnyChart Team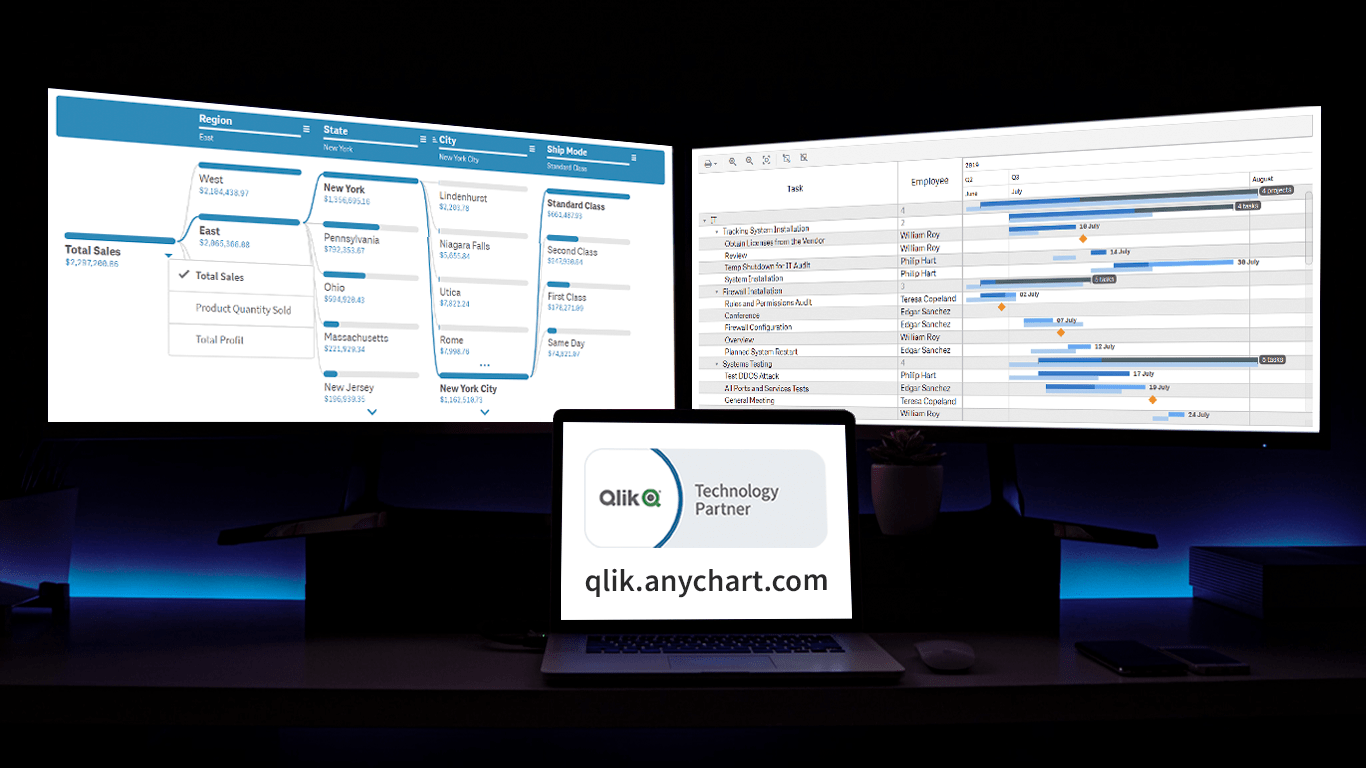 Prepare for an advanced level of data control and customization as we unveil the latest update for our Qlik Sense extensions! The September 2023 release is dedicated to enhancing your visual analytics experience, with a particular emphasis on the Decomposition Tree and Gantt Chart visuals. So, without delay, let’s delve into what’s new.
Read more at qlik.anychart.com »
- Categories: Big Data, Business Intelligence, News, Qlik
- No Comments »
Stock Chart Creation in JavaScript: Step-by-Step Guide
September 5th, 2023 by Shachee Swadia Chances are, you’ve come across various stock charts, whether you’re a seasoned trader or not. If crafting your data graphics piques your interest, you’re in the right place. Welcome to this user-friendly tutorial on building an interactive stock chart using JavaScript!
The JS stock chart we’ll create by the end of this guide will visually compare stock prices for three tech giants — Apple, Microsoft, and Google (Alphabet) — over the past decade. It’s a robust example to illustrate the stock charting process and the power of market data visualization.
So, hop on board as we explore the world of stock charts and learn how to create one from scratch.
Read the JS charting tutorial »
- Categories: AnyChart Charting Component, AnyStock, Big Data, Financial Charts, HTML5, JavaScript, JavaScript Chart Tutorials, Stock Charts, Tips and Tricks
- No Comments »