HeadHunter Chooses AnyStock to Visualize hh.index
April 29th, 2011 by Margaret SkomorokhToday we publish a new success story: HeadHunter have chosen AnyStock to visualise hh.index.
HeadHunter, founded in 2000, is a leading Russian Internet recruitment company. Its main asset is the hh.ru site, with a base of 120 thousand job offers and 5.5 million CVs. Companies invite through this site 140 thousand candidates weekly. HeadHunter is a part of Mail.Ru Group – a major Russian Internet company, leading in the number of monthly unique visitors in Russian Internet segment, the owner of ICQ instant messaging service and many other IT companies.
The challenge was to visualize hh.index — the balance between the number of resumes and the number of vacancies submitted at the site for a particular period of time, which is an important index of business and economical activity and requires quality tools. It was needed that chart could be customized on-the-fly.
AnyChart Stock and Financial Charts were chosen, being an excellent tool for visualizing time-based data. It allows creating fully customizable interactive charts, displaying long term data sets in a comprehensible form.
You can enjoy the success story here:
| HeadHunter HeadHunter Chooses AnyStock to Visualize hh.index >> |
Other stories can be found here: https://www.anychart.com/company/success_stories.php
- Categories: AnyStock, Success Stories
- No Comments »
AnyStock 1.1.0 with Drawing Tools for Technical Analysis and Flex Version
April 27th, 2011 by Timothy Loginov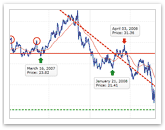 We are proud to release AnyStock 1.1.0 – a new version of Stock and Financial Charts component, where some significant features have been added:
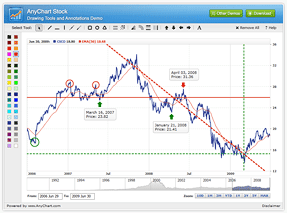
Drawing tools and annotations
AnyStock 1.1.0 offers a complete set of shapes for technical analysis that can be added to the chart plot, both programmatically and via user interface. Already added objects are easy to move, change, and remove.
Available shapes include: line segments, rays, trend lines, vertical and horizontal lines, rectangles, ellipses, triangles, trend channels, Andrew’s pitchforks, Fibonacci fans, Fibonacci arcs, Fibonacci retracements, Fibonacci time-zones, buy/sell signals, and custom text labels to mark important points and trends discovered.
Check out the online demo of these tools: AnyChart Stock: Drawing Tools and Annotations Demo.
Flex Component
Flex developers have received the great opportunity to use AnyStock and build smart scrollable charts into their rich internet applications and trading solutions.
Improvements
A huge performance improvement for mouse over the chart area has been made, as well as an improvement in range picker behavior: input values and input masks are now internally trimmed.
Misc
Besides that, a few bugs have been fixed and several minor features have been added, such as:
- a wide range of options that are intended to control the display of missing points;
- a new boolean attribute named adjust_margins that allows to add dynamic margins;
- the possibility to use RangeArea, RangeSplineArea or RangeBar series types to visualize Bollinger Bands;
- the possibility to configure event markers position.
- Categories: AnyStock
- No Comments »
- Categories: News
- No Comments »
- Categories: AnyChart Charting Component, Success Stories
- No Comments »
- Categories: AnyGantt, Success Stories
- No Comments »
- Categories: AnyStock, News
- No Comments »
- Categories: AnyChart Charting Component, Success Stories
- No Comments »
Full list of fixes, features and improvements: http://6.anychart.com/products/anystock7/history/
You can take look at the product page: http://6.anychart.com/products/anystock7/overview/
Or download the new version: https://www.anychart.com/download/
Registered customers can obtain the latest build from the Customer Area.
Happy Easter
April 24th, 2011 by Margaret SkomorokhWe wish a happy Easter and a happy week ahead filled with energy and joy to all our existing and future clients!
By the way, a lot of great news is coming soon.
Xlinesoft.com Chooses AnyChart for Its Web Authoring Tools
April 19th, 2011 by Margaret SkomorokhA new success story that we are glad to post here is about a company from the Software Development industry.
Xlinesoft.com is a software development group. It focuses on providing innovative, powerful yet easy-to-use Internet-related software products that are designed for helping users to make Web authoring easy. With Xlinesoft tools, thousands of people can quickly design online applications.
The ability to display charts is critical for any modern rich Internet application, so most users were demanding modules making possible to visualize data from their databases as charts.
AnyChart charting modules were an excellent solution, because the work of the component doesn’t depend on server-side support, which makes it compatible with different kinds of apllications and allows to lower development and licensing costs. Users are pleased with perfect design, usability and multiple configuration options of AnyChart charts.
You can enjoy the success story here:
| XlinesoftXlinesoft.com Chooses AnyChart for Its Web Authoring Tools >> |
Other stories can be found here: https://www.anychart.com/company/success_stories.php
Eugeniy Stern Recommends AnyGantt to His Clients
April 11th, 2011 by Margaret SkomorokhWe are happy to publish a new success story, this time about Eugeniy Stern – an independent SAP development consultant, who has been working in this field since 1997, assisting large enterprises in oil-producing, oil-refining and transport industries. In some of his projects, he used AnyGantt.
The SAP NetWeaver technology platform enables the composition, provisioning, and management of SAP as well as non-SAP enterprise software applications. There is a built-in solution for creating Gantt charts, but it was found lacking visual appeal needed for business reporting.
After a market research, it appeared that AnyGantt fits best of all the charting components. AnyGantt was recommended to the clients, and during this year, a few projects using AnyGantt in SAP NetWeaver will be launched.
The story can be found here: Eugeniy Stern Recommends AnyGantt to His Clients >>
Other stories: https://www.anychart.com/company/success_stories.php
AnyStock v1.1.0 Preview: Drawing tools & Annotations
April 5th, 2011 by Timothy LoginovAnyStock with Drawing tools and Annotations will be available very soon – we plan to release version 1.1.0 on the 15th of April, along with other fixes and great new features.
Drawing tools are currently in beta stage, and we are eager to hear your comments and suggestions. Basically, AnyStock v 1.1.0 will provide you the ability to add line segments, rays, infinite lines, vertical and horizontal lines, rectangles, ellipses, triangles, trend channels, Andrew’s pitchforks, Fibonacci fans, Fibonacci arcs, Fibonacci retracements, Fibonacci time-zones, buy/sell signals, and custom text labels to the chart plot, with the ability to move, change, and remove already added objects.
Feel free to play with the demo presented below and to contact us if you have any questions or comments:
AnyStock Drawing Tools and Annotations Demo
Oleg Patsianskiy Chooses AnyChart for His Consulting Needs
April 4th, 2011 by Margaret SkomorokhThe success story we are presenting today is about Oleg Patsianskiy – an independent strategic consultant assisting various holding and trust companies all over the world.
The challenge was to develop personal multi-purpose BPDs (Business Performance Dashboards) working in real time for combined financial and operational data. AnyChart proved to be the best solution, which provides analytics on the fly and allows easy customization of the output.
“AnyChart products are way beyond any other charting solutions available on the market due to its flexible XML input customization and AJAX-based interactivity,” Oleg Patsianskiy said.
You can read this success story here: Oleg Patsianskiy chooses AnyChart for his consulting needs >>
Other stories: https://www.anychart.com/company/success_stories.php