Introducing Chartopedia to Help You Choose the Right Chart Types for Your Data Visualization
January 18th, 2017 by AnyChart Team Choosing the right chart types for data analysis and reporting solutions is always a challenge. In fact, there are so many data visualization options out there that it can be really complicated to determine which one to use in a certain situation. And you cannot afford to make a mistake here, because applying data to an inappropriate type of chart will very likely end up causing confusion and even wrong business decisions.
To help you cope with this issue better (and faster), we have developed an information resource named Chartopedia, and it is a pleasure for us to introduce it to you today.
- Categories: AnyGantt, AnyMap, AnyStock, Business Intelligence, Financial Charts, Gantt Chart, HTML5, JavaScript, News, Stock Charts, Tips and Tricks, Uncategorized
- 1 Comment »
AnyChart Open-Sources Powerful, Draw-Anything JS Graphics Library GraphicsJS
September 15th, 2016 by AnyChart TeamIt is a pleasure for us to announce this today! We have just launched GraphicsJS, a free, open-source, lightweight JavaScript library which allows you to draw any JS graphics and animation for your HTML5 projects very easily. It is significantly more powerful and feature-rich than Raphaël, BonsaiJS, and other formerly leading SVG/VML graphics solutions.
")
GraphicsJS has always been the graphics engine that our JavaScript (HTML5) charting libraries are built on – AnyChart, AnyStock, AnyGantt, and AnyMap. As a result, it already powers data visualization activities for many of you – Oracle, Microsoft, Volkswagen, AT&T, Samsung, BP, Bosch, Merck, Reuters, Bank of China, Lockheed Martin, and thousands of all the other highly respected AnyChart’s customers including more than 70% of Fortune 1000 companies.
Of course, data visualization is not the only but just one of multiple fields where the library of GraphicsJS can be helpful and even essential. Generally speaking, this solution can help you produce virtually anything graphical from scratch: static and animated images, cartoons, games, interactive infographics, mind maps, and many other amazing things in HTML5.
Key Features of JS Graphics Library
- Mighty line drawing abilities – Bézier curves, arcs, rectangles, and many other kinds of forms and deformations.
- Powerful text manipulation features – multiline texts, measurement, including width, height, as well as wrap, overflow, indent, spacing, align, etc.
- Virtual DOM for drawing fast and only what is necessary.
- Smart layering system with z-index.
- Transformation engine – embarrassing in-browser transformations are not used.
- Legacy browser support (Internet Explorer 6+).
- Concise and convenient JavaScript API with chaining support.
By the way, making our graphics engine open-source is just the beginning as – we are also pleased to tell you – AnyChart is going to open the source code of our charting libraries soon! We believe that our great developments in the fields of graphics and data visualization should be even more visible and reachable to any programmer from any part of the world, not to mention that we would love to allow the community to contribute.
Please refer to GraphicsJS.org to learn more about GraphicsJS. As always, the demos are available on our Playground (Graphics section). Also, let’s not forget about the Graphics Documentation and Graphics API Reference.
What’s more, the GraphicsJS library and all relevant samples can be freely downloaded and forked on GitHub.
- Categories: AnyChart Charting Component, AnyGantt, AnyMap, AnyStock, Charts and Art, Dashboards, Financial Charts, Gantt Chart, GraphicsJS, GraphJam, HTML5, JavaScript, News, Stock Charts, Third-Party Developers, Tips and Tricks, Uncategorized
- 5 Comments »
Recap of the Week – 9/21/2015
September 21st, 2015 by Margaret SkomorokhIn this post you will find a recap of news on data visualization and AnyChart (which we have shared with you this week on AnyChart Facebook Page and here):
- We have created a basic sample to show how you can work with AnyChart JavaScript charts in an SWT application.
- What’s really warming the world? – a nice interactive chat that will help you to explore different factors contributing to global warming.
- Gloam.io – an interactive data visualization of sunrise, sunset, and twilight times. (You can also read an article explaining some interaction details in Gloam.io – http://bit.ly/1UQGsgn)
- Why we still need women’s equality day? – Take a look at this great infographic by TIME and learn some sad numbers.
- 17 Graphs That Are Way Too Real For Introverts.
- Categories: AnyChart Charting Component, HTML5, JavaScript, Uncategorized
- No Comments »
New Partnership Announcement: Datonix and AnyChart
May 22nd, 2015 by Margaret SkomorokhWe are very pleased to announce that AnyChart have partnered with Datonix.
Datonix primary product is datonixOne, a computer appliance designed for BIGDATA Solutions and eXpress development. Using datonixOne, Federated BIGDATA applications can be quickly developed, providing ready information for end users.
AnyChart partners: https://www.anychart.com/partners/.
- Categories: AnyChart Charting Component, Success Stories, Third-Party Developers, Uncategorized
- No Comments »
Holiday Greetings 2012
December 25th, 2012 by Margaret SkomorokhMerry Christmas and a wonderful New Year to all our customers and friends around the world and thank you for your support.
AnyChart keeps moving forward – this year we have significantly improved our HTML5/JavaScript engine, making it almost as functional as the Flash version, introduced seven releases, implemented a number new features, and successfully survived the end of the world. The circle of our customers has widened: here is only a small part of them – those who agreed to make success stories with us.
According to statistics, 75% of resolutions made by Americans are maintained during the first week of the new year, past two weeks – 71%, after one month – 64%, and after 6 months – only 46%:
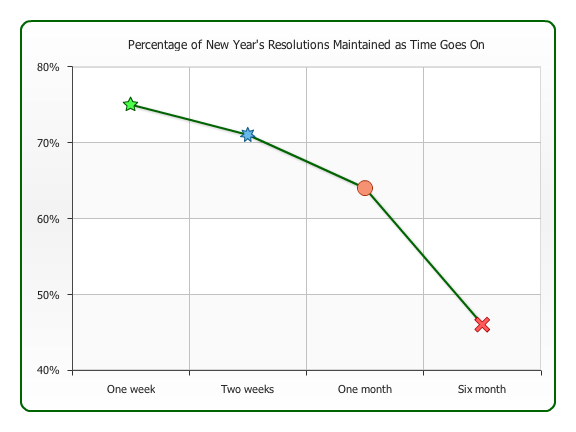
AnyChart’s resolution is to continuously refine our products and provide the best support. We are sure to hold out the whole year 🙂
- Categories: Uncategorized
- No Comments »
Holiday Greetings 2011
December 27th, 2011 by Margaret SkomorokhHoliday greetings and our best wishes for a happy and prosperous New Year!
During the last year AnyChart has made another big step forward. We have successfully implemented new technologies and improved our products. The family of our customers has grown up, as well as our team (new departments have been opened this year). We are sure that our charts will keep delighting your eye, and that AnyChart is a part of the future of web and charting technologies.
Let the new year be productive and joyful for all of us. And to get into the festive mood, take a look at the picture of a dragon sleigh:

- Categories: Uncategorized
- No Comments »
Bug in Flash Player 11.0.1.152: 1/Math.abs(0) is -Infinity
October 26th, 2011 by Timothy LoginovAnyChart Team has found in Flash Player 11.0.1.152 a very weird bug that doesn’t manifest itself in the Debug version of Flash Player, but ruins math in the regular version, so we had to debug it in the non-debug version: using ExternalInterface and JavaScript console.
Bug description
In the regular version of Flash Player 11.0.1.152 the following expression:
1/Math.abs(0)
is evaluated as -Infinity, but in the Debug version it is (as anyone expects): Infinity
Reproduce
Here is a sample code you can use to reproduce this issue:
package {

    import flash.display.Sprite;

    import flash.external.ExternalInterface;
public class MagicWorld extends Sprite {
public function MagicWorld() {
ExternalInterface.call("alert", "1/Math.abs(0) = " + (1/Math.abs(0)).toString());
}
}
}
As soon as you have done this — compile and run the sample in the Debug and Regular versions, and you will see the difference.
The bug has been reported to Adobe: Bug#3011557
The test sample: http://6.anychart.com/temp/bug301157/index.html
- Categories: Uncategorized
- No Comments »
AnyChart Team Developed Ctags for JavaScript based on Google Closure Compiler
October 4th, 2011 by Margaret SkomorokhDeveloping the HTML5 version of AnyChart, our team has not only mastered a variety of tools and utilities, but also created a number of new ones – including Ctags for JavaScript based on Google Closure Compiler (gjstags).
Ctags is a program that generates an index (or tag) file of names found in source and header files of various programming languages. These tags allow definitions to be quickly and easily located by a text editor or other utility. Alternatively, there is also an output mode that generates a cross reference file, listing information about various names found in a set of language files in human-readable form.
Gjstags developed by AnyChart team supports classes, enums, interfaces, and so on. It is based on Google Closure Compiler, works under Mac OS X or Linux and is licensed under Apache License 2.0.
Anyone interested in gjstags can download it here: https://github.com/AnyChart/gjstags and is free to use it in any way.
- Categories: Uncategorized
- No Comments »
AnyChart Supports Bitcoin Project
September 29th, 2011 by Timothy Loginov![]() AnyChart has licensed out AnyStock — the best web component for time-based and financial data visualization — to Bitcoin2 project, thus becoming its technology sponsor.
AnyChart has licensed out AnyStock — the best web component for time-based and financial data visualization — to Bitcoin2 project, thus becoming its technology sponsor.
Bitcoin is an open source peer-to-peer network created in 2009 by Satoshi Nakamoto (whose real identity is unknown).
It tracks and verifies transactions in bitcoins — a digital currency which is generated by Bitcoin software. When the program is run, users’ computers are constantly trying to solve cryptographic puzzles to get bitcoins as a reward. As more coins are generated, the puzzles get harder, and the reward goes down, which makes Bitcoin a deflationary currency. Bitcoins can be converted to and from other currencies, primary by online exchange services. In August 2011, there were over 7.1 million bitcoins in existence.
Currently, a new version of the Bitcoin algorithm is developed – Bitcoin2. Its aim is to raise bitcoins’ liquidity by making transactions safer, creating a congenial investment climate for financial companies, and providing person identification tools so that the system could be used within the international legal framework.
Bitcoin’s ideology is close to crypto-anarchism that expounds the use of strong public-key cryptography to bring about privacy and freedom.
- Bitcoin2 Project — a new generation of virtual currency for B2B and B2C.
- AnyStock — Stock and Financial Flash Charting Component.
- Categories: Uncategorized
- No Comments »
Flash Player Printing Bug Discovered
February 15th, 2011 by Margaret SkomorokhDuring AnyGantt development, we have discovered a bug in the latest builds of Flash Player (existing since August 2010).
Here is a Flex example from the Adobe Help Resource Center:
http://livedocs.adobe.com/flex/3/html/help.html?content=printing_5.html
That’s how everything looks like in the original:
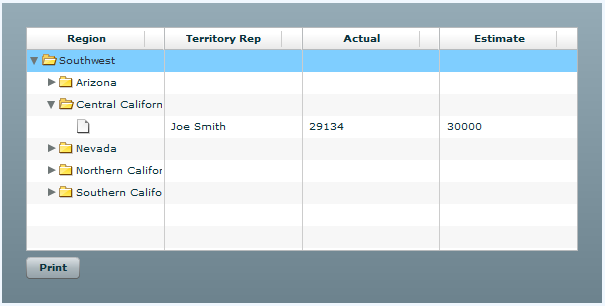
And that’s what happens to it after printing:
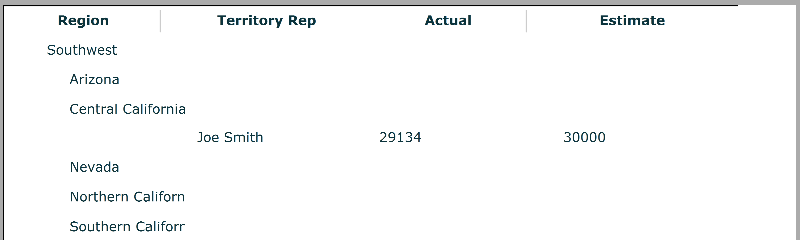
A long and persistent debugging has led us to isolating and reproducing the bug. In the simplest view, everything comes down to the following pictures:
(an original)
(the same after printing)
The source code of the example can be downloaded from:
https://bugs.adobe.com/jira/secure/attachment/68017/test_02_project_src.zip
The cause of the problem is the following: if the text in the Visual Objects tree has a parent object with “scrollRect”, there will be problems when printing to a bitmap.
The bug appeared supposedly in the version 10.1.82.76 of Adobe Flash Player, and it is also found in the current version (10.2).
We have submitted a bug report and now are waiting for the response:
https://bugs.adobe.com/jira/browse/FP-6167
- Categories: Uncategorized
- 1 Comment »