Best Data Visualizations We’ve Come Across Most Recently — DataViz Weekly
October 28th, 2022 by AnyChart Team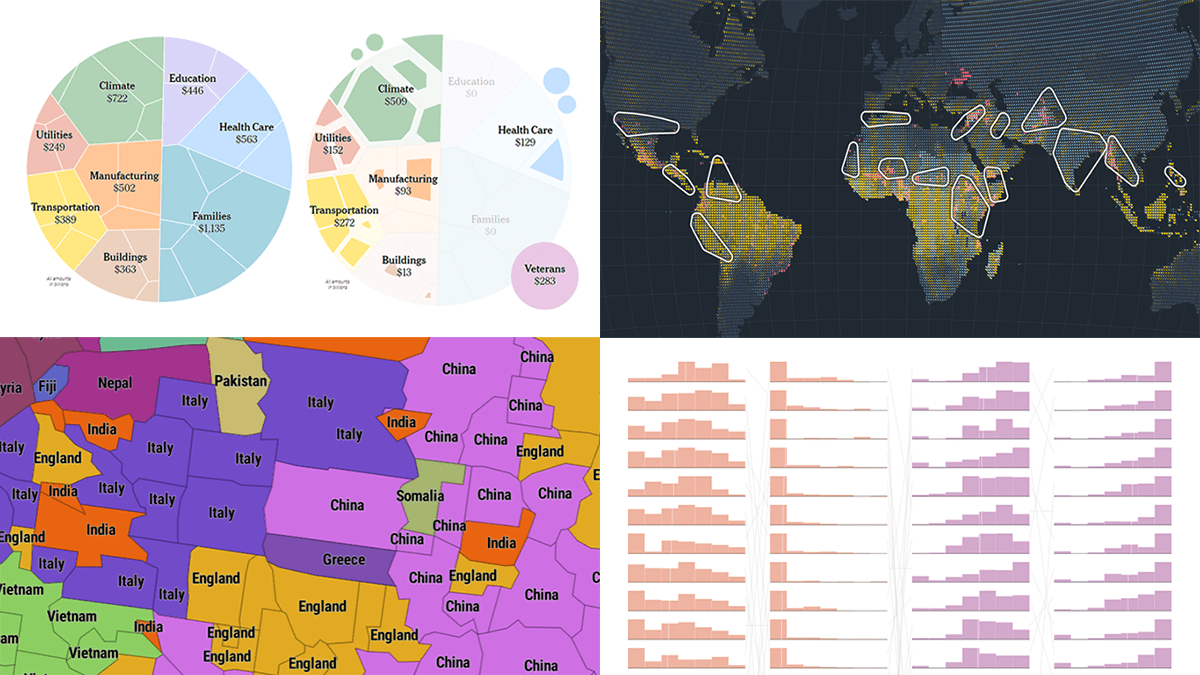 Interesting charts and maps come out all the time. DataViz Weekly is here to show you the best data visualizations we have seen most recently! Look at our newest picks!
- Feelings at work by occupation — FlowingData
- Impact of climate on conflicts — Auswärtiges Amt (German Foreign Office)
- U.S. President Biden’s legislative agenda — The Upshot
- Australians’ birth countries, languages, and religions — SBS News
- Categories: Data Visualization Weekly
- No Comments »
Stunning New Data Visualization Examples Around Internet — DataViz Weekly
October 21st, 2022 by AnyChart Team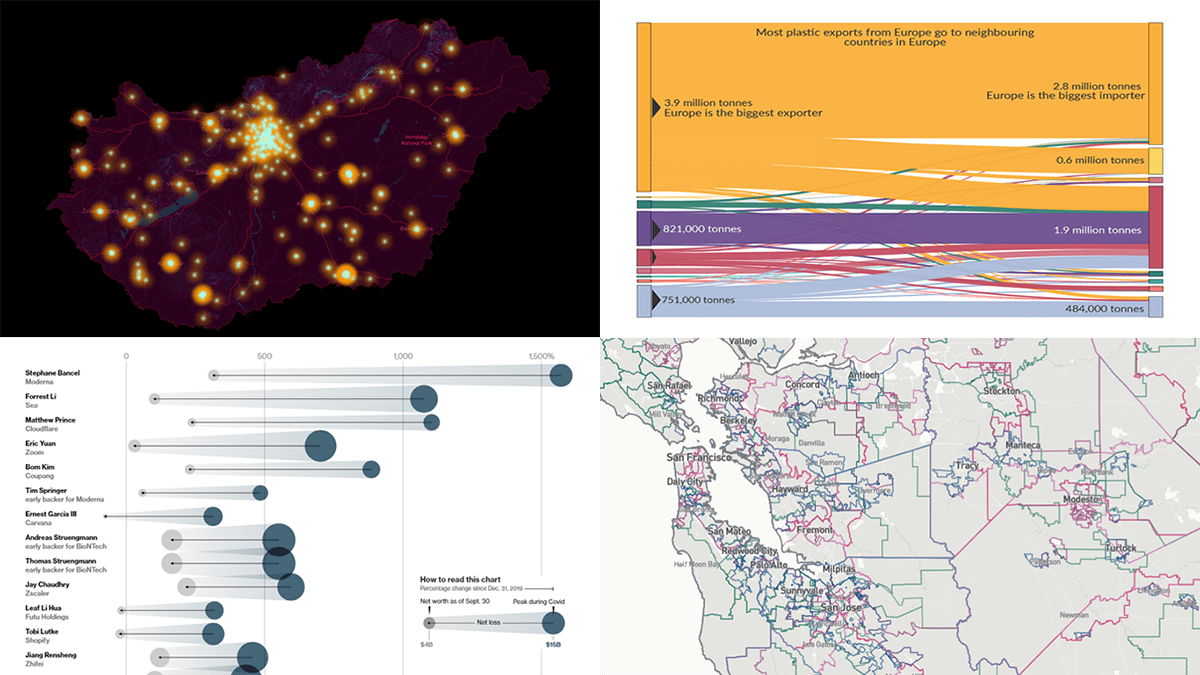 Continuing our regular series DataViz Weekly, we’re glad to bring to your attention several stunning data visualization projects as great new examples of professional charting and mapping in action!
- Global plastic waste trade — Our World in Data
- Teacher protests in Hungary — ATLO
- Rise and fall of COVID-19 billionaires — Bloomberg
- All U.S. midterm elections where you live — USAFacts
- Categories: Data Visualization Weekly
- No Comments »
New Election Maps to Check Out — DataViz Weekly
October 14th, 2022 by AnyChart Team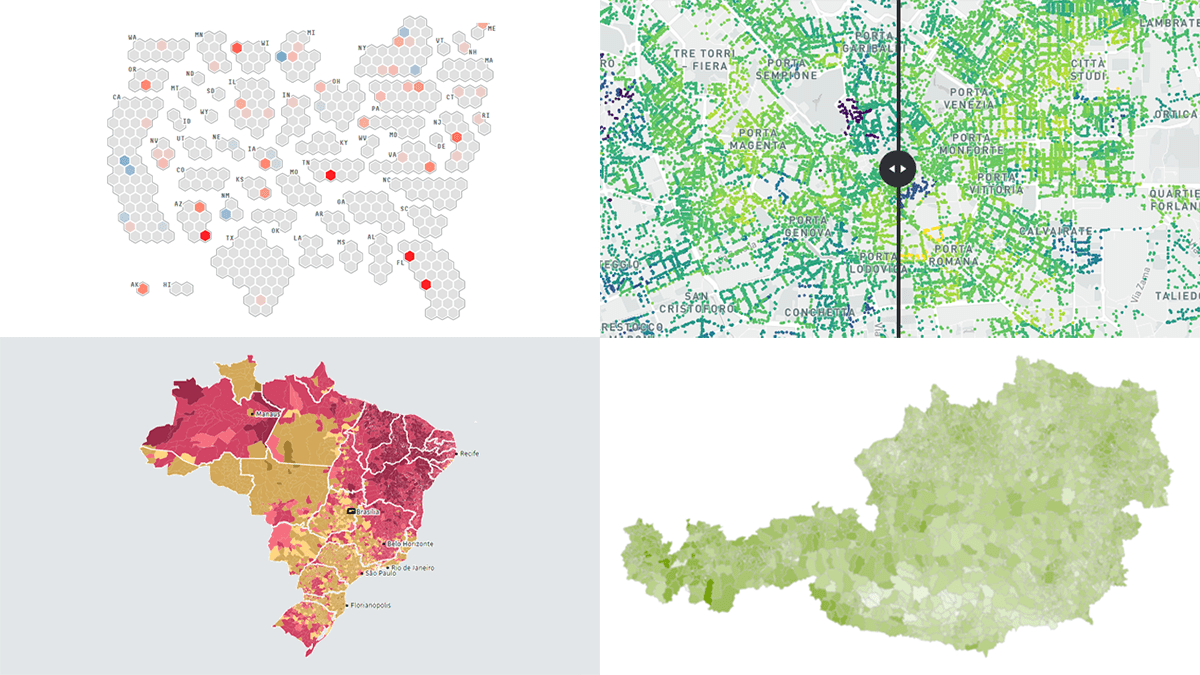 Some of the election races scheduled for this fall have already ended. Others are yet to be decided. And obviously now is a time for election maps to shine again! In this DataViz Weekly piece, we highlight a selection of maps visualizing data on the recent votes in Italy, Austria, and Brazil, as well as the upcoming midterm elections in the United States. Take a look.
- Categories: Data Visualization Weekly
- No Comments »
How to Create Word Tree Using JavaScript
October 14th, 2022 by Awan Shrestha It is a pure fact that a graphical or pictorial representation of data, known as a data visualization, conveys information faster than raw data in arrays, spreadsheets, or dense reports. Charts make data easier to understand, which further helps to quickly develop valuable insights. Interesting, right? Now, let’s have a look at one chart type called a word tree and see how to build it with ease.
A word tree is a data visualization form designed to show multiple parallel sequences of words (or phrases) as they appear in a text. Analyzing texts becomes easier with word trees as they display, by means of a branching structure, how selected words are connected to others.
In this tutorial, I will walk you through the process of creating a beautiful word tree chart with JavaScript (HTML5). The text being visualized will be the famous speech “I Have a Dream” by minister and civil rights activist Martin Luther King Jr. Each step will be explained in detail, and you’ll see everything is pretty simple. Sit tight and enjoy the learning!
Read the JS charting tutorial »
- Categories: AnyChart Charting Component, HTML5, JavaScript, JavaScript Chart Tutorials, Tips and Tricks
- No Comments »