Wide variety of JavaScript Chart types
AnyChart product family includes more than 79 different chart types and we're constantly adding new ones.Five resources to learn AnyChart
Each day we doing out best to make AnyChart learning process as easy and convenient as possible200+ tutorials on how to create interactive JavaScript charts and utilize every charting feature available in AnyChart's libraries. Each article is illustrated with relevant data visualization examples that can be modified on the fly using our Playground.
Comprehensive and detailed descriptions of each namespace, class, method, and property available in the AnyChart JavaScript charting API. All entries feature links to ready-to-use interactive chart samples.
All interactive JS charting samples used in AnyChart's Documentation, API Reference, and Chartopedia. Here you can play with their JavaScript and full HTML source code as well as freely modify any example, run it, etc.
60+ chart types explained, illustrated, and grouped into 8 categories by purpose. Here you'll be able to learn all about each chart type supported in AnyChart's JavaScript charting libraries and always choose the right one for your data visualization.
Easy-to-follow, step-by-step tutorials created by our team and guest bloggers show how to quickly visualize real-world data in elegant interactive JS charts of various types. Have fun learning.
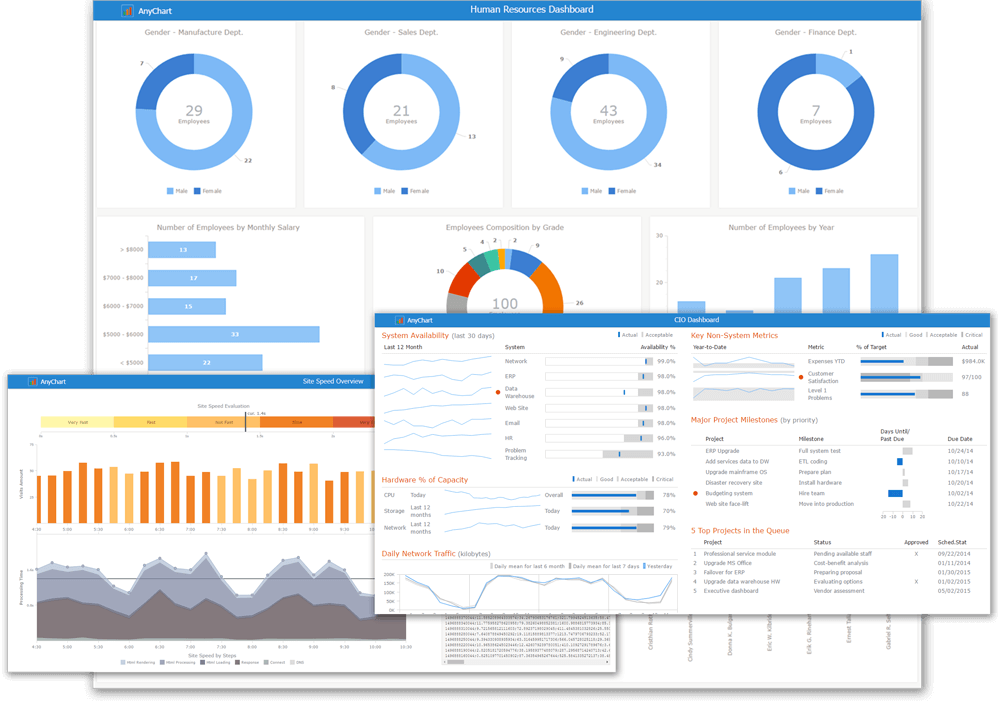
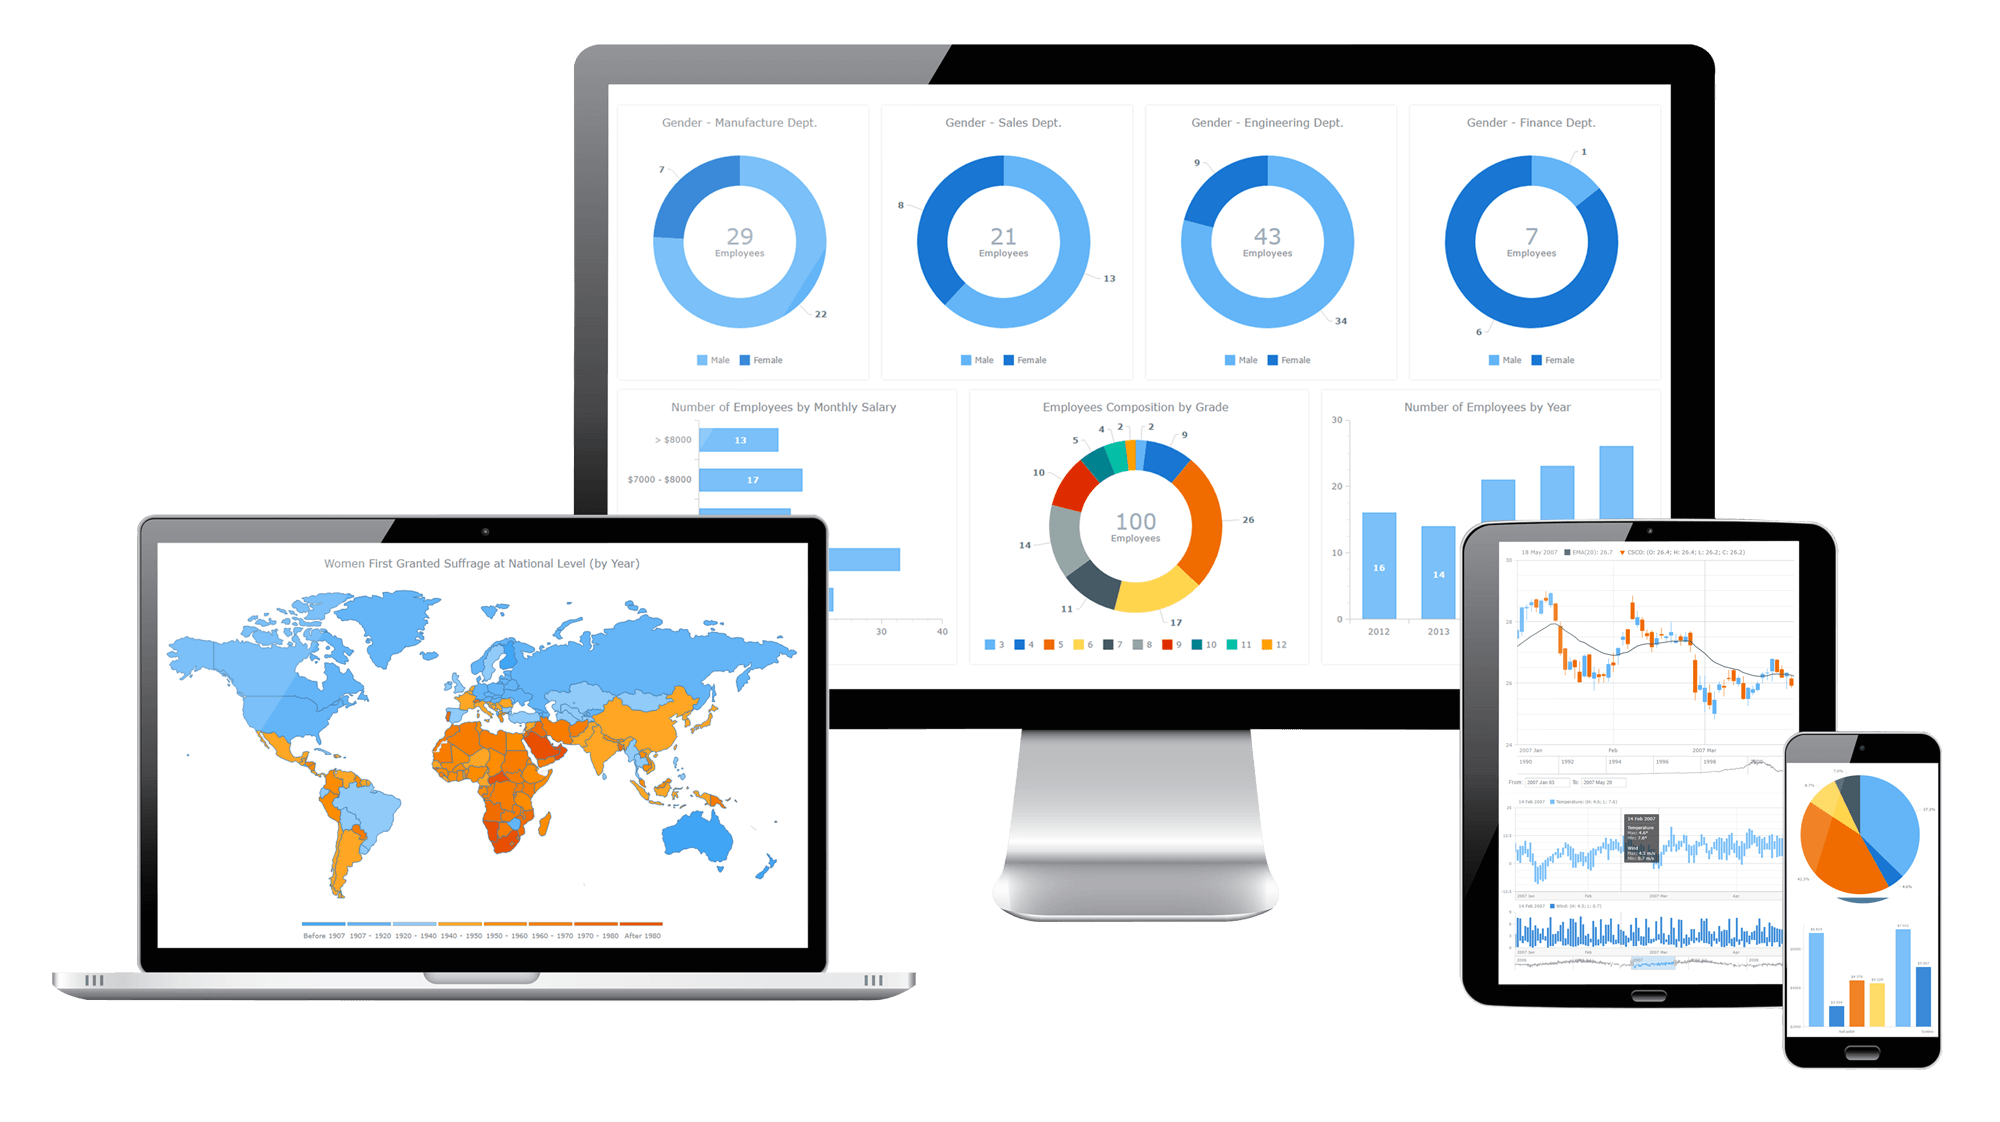
Business intelligence dashboards arrange numbers, metrics and performance scorecards on a single screen. Dashboards help executives, management, and employees to view KPI's and assess the situation. BI dashboards help to understand the data and improve the efficiency of an organization.
AnyChart provides many sample web-applications with interactive BI dashboards. Every interactive JavaScript dashboard in these apps is created with AnyChart.
Thousands of companies already use AnyChart to create interactive dashboards. Join us and build your own!
Are you building Sales Dashboard, Site Speed Monitor, CIO Dashboard, Investment Portfolio, Human Resources Dashboard, Technical Support Dashboard? AnyChart can do this and more.
Samples for Your Stack
AnyChart can run on any platform and with any database. These samples were created to demonstratehow AnyChart JavaScript charts can be easily integrated into your environment.