Season’s Greetings!
December 25th, 2010 by Margaret SkomorokhBest wishes for the holidays and for health and happiness throughout the coming year. We hope this year you found our products convenient and comfortable and assure that you will like them even more the next one – before the New Year’s Eve we will yet gladden you by news and announcements.Among AnyChart’s clients there are market leaders and startups without websites, our OEM or SAAS partners and enterprise solution developers; some are now taking ocean-facing baths and some are being filled up with snow. They have different views and ideals, but all of us are united by the love for beauty and aesthetics even in such a serious field as business, financial and statistical graphics. Happy Charting Everybody!

P.S.: Cheshire kitten by one of our favorite artists Vlad Gerasimov: http://www.vladstudio.com
- Categories: Uncategorized
- No Comments »
AnyChart Stock and Financial Charts Now Available
December 14th, 2010 by Margaret SkomorokhWe are happy to announce the availability of AnyStock, a cross-platform tool for implementing stock and financial charts in custom web and desktop applications. Perhaps, creating of AnyChart Stock has taken more time than anticipated, but we are proud of its quality and of the results achieved.
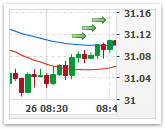
The component includes a wide variety of technical indicators and financial chart types, all of them being combinable. The ability to review long term and large data sets can be handled with scroll, pan, and zoom controls. Adding news events – analyst opinions, insider trading, dividends, and key developments – helps to analyze information.
It should be especially noted that the Resources section contains countless application samples and adjustments for JSON as well as XML, so developing and tuning charts in your application will be really easy.
Some of the key features are:
Show Significant Events Using Special Markers
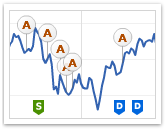 |
One of the most important features of AnyStock are Event Markers – a special type of chart markers that are created to provide best experience in showing Key Developments, Dividends, Splits, Insider Transactions, Analyst Opinion Changes or any other events on Financial charts. Event markers can be bound to a chart series or to the timeline. |
Real-Time Data Streaming and Data Manipulations
 |
A full feature set for creating real-time streaming and data manipulation applications is available. The JavaScript library coming with the component has methods that allow adding, updating, removing or inserting new data points or range of points. All the operations run fast and smart and allow setting new data without reloading the chart. |
Fully Configurable Localization
 |
The component allows localizing the appearance of date, time and numbers to suit the region’s language and cultural peculiarities. To make the localization even easier, a special utility was created that allows obtaining the required regional configuration in a matter of minutes. |
Advanced Interactivity
 |
AnyChart Stock is fully interactive. All of its navigation elements meet all the industry’s usability standards and are very comfortable in use. |
Attractive and Flexible Visual Settings
 |
All the visual elements are configured to provide the best user experience: mild and clear colors, intuitive controls, and so on. Almost every part of a chart can be quickly customized. |
We hope that you will appreciate the component. If you have any additional questions, our Support and Sales teams are ready to help you.
Please download the trial version: https://www.anychart.com/download/
And visit the product page: http://6.anychart.com/products/anystock7/overview/
- Categories: AnyStock
- No Comments »