How to Build Point Map with JavaScript
December 22nd, 2023 by Awan Shrestha If you’re a budding developer or data enthusiast eager to explore map creation, you’re in the right place. In this tutorial, I’ll guide you through how to easily build an interactive point map using JavaScript.
To make things even more interesting, I’ll use data on the number of millionaires in cities as an example. By the end of this tutorial, you’ll have made a visually stunning JS point map, ready to tell the story of the world’s wealthiest cities and a solid understanding of applying these skills to any data and scenarios. And stick around for a bonus at the end — I’ll also show you how to transform your point map into a bubble map where the size of the markers conveys additional information.
Ready to master the JS point mapping technique? Let’s get started, and don’t forget to join me in the bonus section where size matters!
Read the JS charting tutorial »
- Categories: AnyChart Charting Component, AnyMap, Big Data, HTML5, JavaScript, JavaScript Chart Tutorials, Tips and Tricks
- No Comments »
Unwrapping Enhanced Interactivity for Calendar and Circle Packing Charts in AnyChart 8.12.0
December 7th, 2023 by AnyChart Team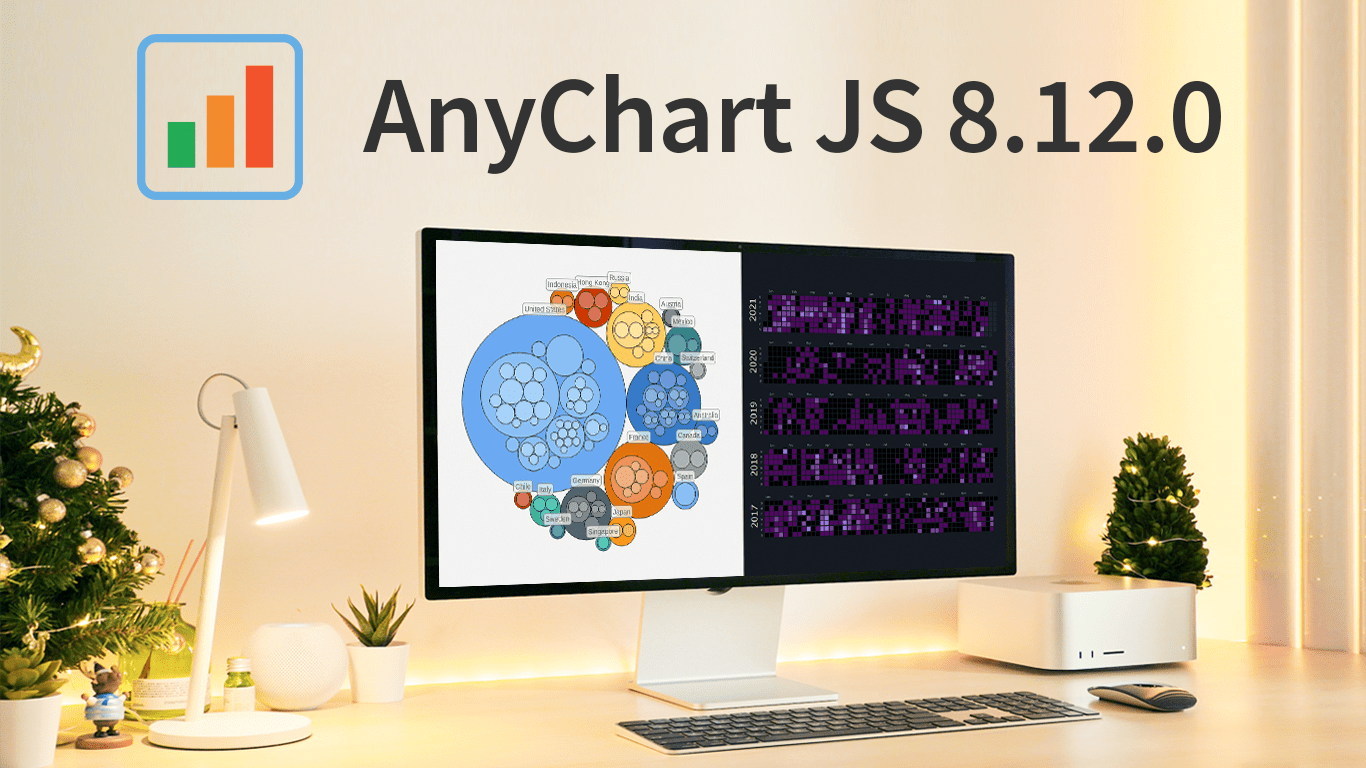 As the magic holiday season approaches, we’re thrilled to unwrap our latest gift of the year — AnyChart 8.12.0, the newest version of our powerful JavaScript charting library. Packed with various bug fixes and improvements, this release introduces a remarkable feature for Calendar and Circle Packing charts — interactivity events. Learn more about it and upgrade right now!
- Categories: AnyChart Charting Component, AnyGantt, AnyMap, AnyStock, Big Data, Business Intelligence, Dashboards, Financial Charts, Gantt Chart, HTML5, JavaScript, News, Stock Charts
- No Comments »