Happy Holidays and Year-End Note for 2025
December 23rd, 2025 by AnyChart Team As 2025 winds down, we want to say thank you to our customers, partners, and everyone who builds and uses analytics every day. Merry Christmas and Happy New Year from all of us at AnyChart!
Closing out 2025, we are sharing this holiday sweater as a small nod to a theme we focused on this year ?
- Categories: AnyChart Charting Component, Big Data, Blogroll, Business Intelligence, Dashboards, Humor, JavaScript, News, Qlik
- No Comments »
20+ Years of Advancing Data Visualization: Interview with Our CEO
February 5th, 2025 by AnyChart Team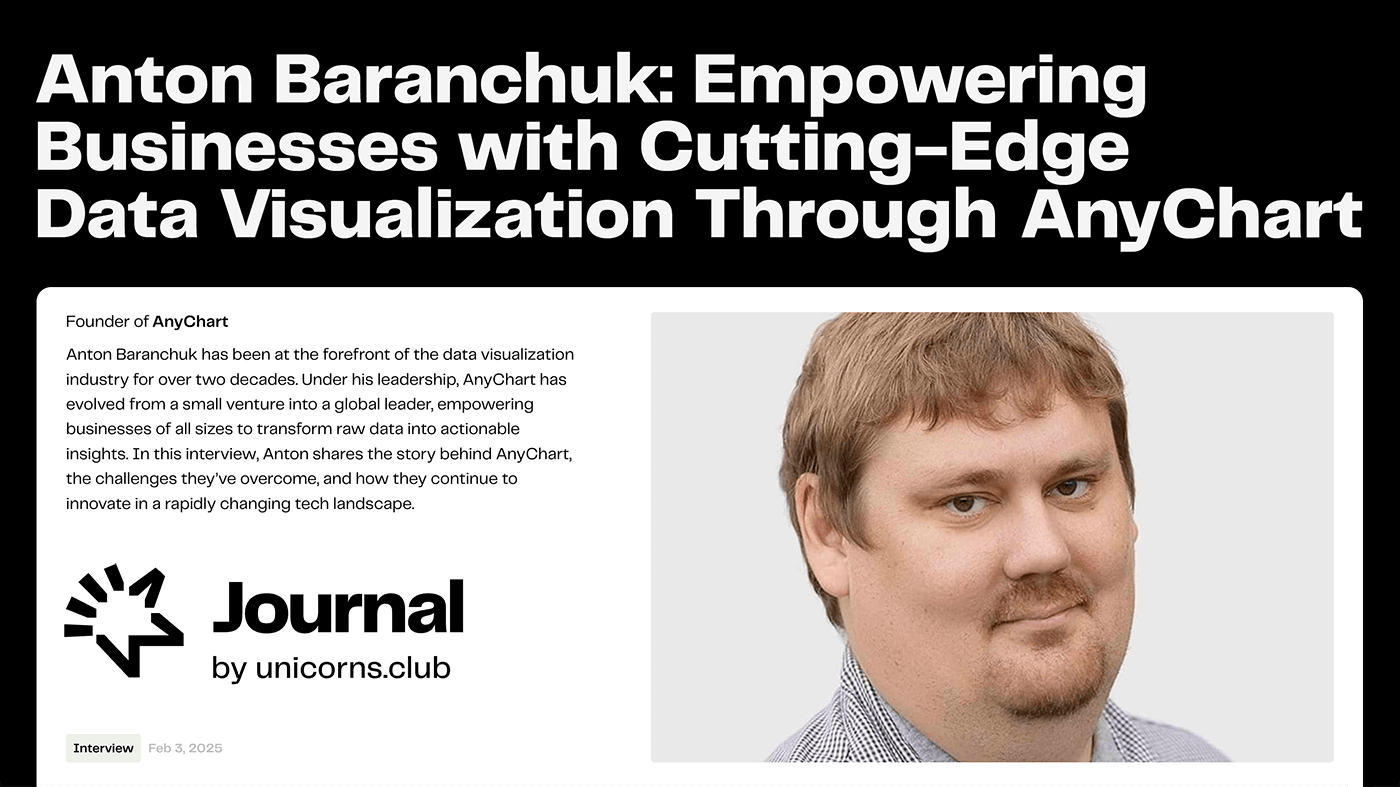 Unicorns Journal just published an interview with our CEO and co-founder, Anton Baranchuk, where he reflects on AnyChart’s journey from a small startup to a global leader in data visualization, trusted by enterprises worldwide.
Anton talks about how we got started, the transition from Flash to JavaScript charting, our work with Qlik, and the vision and values that continue to drive us forward.
- Categories: AnyChart Charting Component, AnyGantt, AnyMap, AnyStock, Big Data, Blogroll, Books, Business Intelligence, Dashboards, Financial Charts, Flash Platform, Gantt Chart, GraphicsJS, HTML5, JavaScript, News, Oracle Apex, Qlik, Stock Charts, Success Stories
- No Comments »
Reflecting on 2024 and Embracing 2025 — Happy New Year!
January 9th, 2025 by AnyChart Team Another remarkable year is officially in the books! Here at AnyChart, 2024 was a truly rewarding journey marked by innovation and impact:
- Named Best Tech in Data Analytics & Visualization — once again!
- Enhanced our JavaScript charting library with exciting new features and tweaks, particularly in Timeline, Waterfall, and Circle Packing charts — plus multiple custom solutions tailored to your specific needs.
- Thrived in the Qlik ecosystem with transformative updates for our extensions for Qlik Sense, rocking Qlik Connect in Orlando, and more — explore our 2024 highlights as Qlik’s Technology Partner.
As we step into 2025, we remain committed to pushing the boundaries of data visualization and analytics, ensuring you always have the tools you need to excel and succeed. Here’s to an even greater year ahead — happy 2025, and stay tuned for what’s coming next!
- Categories: AnyChart Charting Component, AnyGantt, AnyMap, AnyStock, Big Data, Blogroll, Business Intelligence, Charts and Art, Dashboards, Financial Charts, Gantt Chart, HTML5, JavaScript, News, Qlik, Stock Charts
- No Comments »
AnyChart Triumphs Again: Awarded Best in Data Analytics and Visualization in 2024
February 19th, 2024 by AnyChart Team We are delighted to announce that AnyChart has won the prestigious 2024 DEVIES Awards in the Data Analytics & Visualization category, marking our victory for the second consecutive year!
The award celebrates our JavaScript charting library, continuously acknowledged as the world’s leading data visualization solution for developers. As AnyChart JS forms the cornerstone of our broader product line, this recognition once again highlights the technological excellence and innovation inherent in our entire suite of offerings, including the extensions for Qlik Sense.
- Categories: AnyChart Charting Component, AnyGantt, AnyMap, AnyStock, Big Data, Blogroll, Business Intelligence, Dashboards, Financial Charts, Gantt Chart, HTML5, JavaScript, News, Oracle Apex, Qlik, Stock Charts, Success Stories
- No Comments »
Remembering 2023, Welcoming 2024
January 10th, 2024 by AnyChart Team Happy New Year! As the last echoes of festive celebrations fade away and we dive into the adventures of 2024, let’s bid a final farewell to 2023 by reflecting on its best moments.
For us at AnyChart, it was a remarkable year:
- Celebrated our 20th anniversary — indeed, we’ve been innovating since 2003.
- Awarded as the Best in Data Analytics & Visualization.
- Introduced more cool features and tweaks to our JavaScript charting library and other solutions.
- Launched new powerful extensions for Qlik Sense, with the Decomposition Tree taking center stage — join us in reviewing our year in the Qlik ecosystem.
- Reached some noteworthy milestones — now boasting over 80 JS charting tutorials on our blog, our Android charting library gleaming with over 2K stars on GitHub, and our social media family expanded to over 20K followers.
Looking ahead, our dedication remains unwavering: to empower your data viz and analytics journey with new and better tools. Thank you for growing with us, and cheers to your continued success, brighter and bolder in 2024!
- Categories: AnyChart Charting Component, AnyGantt, AnyMap, AnyStock, Big Data, Blogroll, Business Intelligence, Charts and Art, Dashboards, Financial Charts, Gantt Chart, HTML5, JavaScript, News, Qlik, Stock Charts
- No Comments »