Advices by Edward Tufte: Importance of Context for Charts
July 29th, 2011 by Margaret SkomorokhWe continue posting tips from Edward Tufte‘s works. In The Visual Display Of Quantitative Information, he puts a lot of attention to the problem of lying in charts.
It is assumed that charts are aimed to show the truth about data in the most demonstrative way, but this demonstrativeness is a two-edged weapon. Owing to some tricks – or mistakes – data may seem not what they are. One of them is the lack of context.
According to Tufte,
To be truthful and revealing, data graphics must bear on the question at the heart of quantitative thinking: “Compared to what?” The emaciated, data-thin design should always provoke suspicion, for graphics often lie by omission, leaving out data sufficient for comparisons.
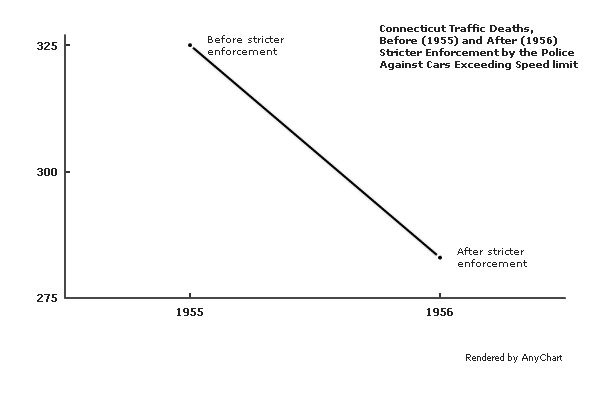
The author gives an example of such a graphic – it shows the number of traffic deaths before and after stricter enforcement by the police against cars exceeding the speed limit:
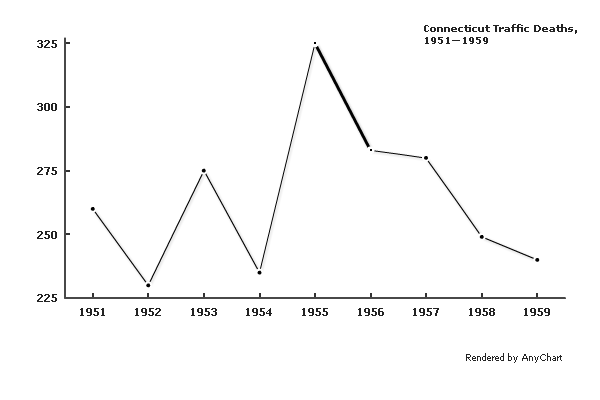
A few more data points make the situation much clearer:
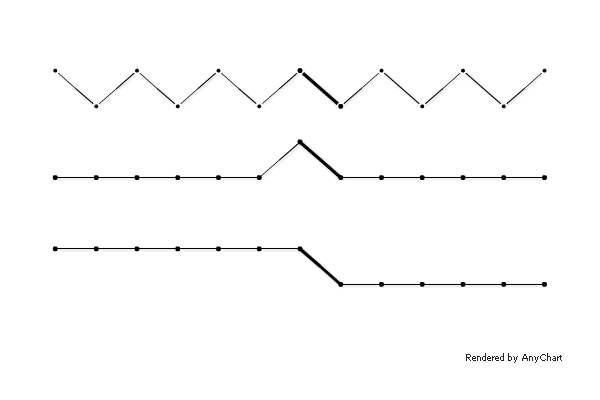
A different context would cause a very different interpretation:
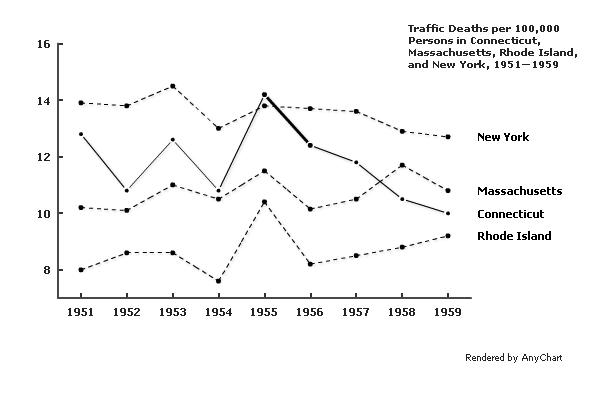
Comparison to adjacent states shows that the crackdown on speeding decreased the number of traffic fatalities not only in Connecticut:
Of course, if one needs to distort the meaning of data, concealing the context may be a relatively useful tip, but in other situations, it is definitely a mistake. The principle formulated by Edward Tufte is:
Graphics must not quote data out of context.
- Categories: AnyChart Charting Component, Tips and Tricks
- No Comments »
AnyChart GraphJam: Lord of the Rings 3D Column Chart
July 22nd, 2011 by Margaret SkomorokhAmong numerous chart types that AnyChart allows creating there are 3D Column Charts. Using this tool, we have made our version of a GraphJam chart that wittily mocks the good old Lord of the Rings trilogy:
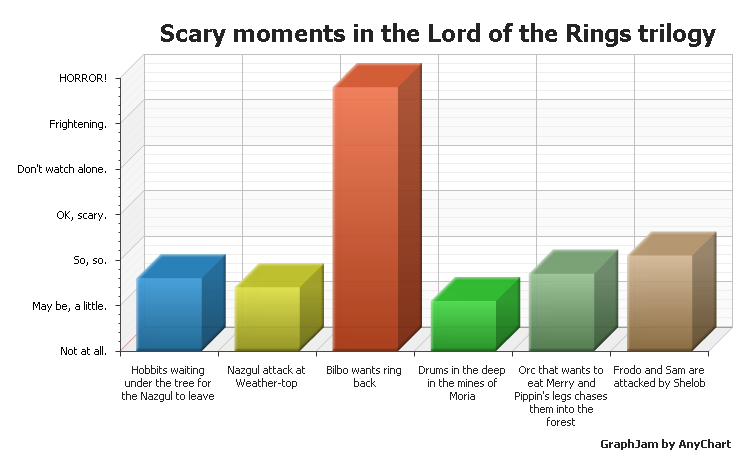
To check out other examples of 3D Column Charts, visit 3D Column Charts section in AnyChart charts gallery.
- Categories: AnyChart Charting Component
- No Comments »
AnyStock 1.4.0 Available
July 6th, 2011 by Margaret SkomorokhThe ability to set left and right timescale paddings in pixels was in extreme demand, and we always do our best to provide our customers with as wide range of built-in technical indicators as possible – so we have decided not to put off the AnyStock 1.4.0 update that gives you the full control of timescale margins and three new technical indicators:
Thus, AnyStock has become even better than before and now supports already 30 built-in and ready-to-use technical indicators.
Download AnyStock 1.4.0: https://www.anychart.com/download/
Version history: http://6.anychart.com/products/anystock7/history/
- Categories: AnyChart Charting Component
- No Comments »
AnyChart 5.1.3 Released
July 6th, 2011 by Margaret SkomorokhWe are proud to announce the availability of the long-awaited AnyChart 5.1.3 with new chart types and numerous fixes and improvements!
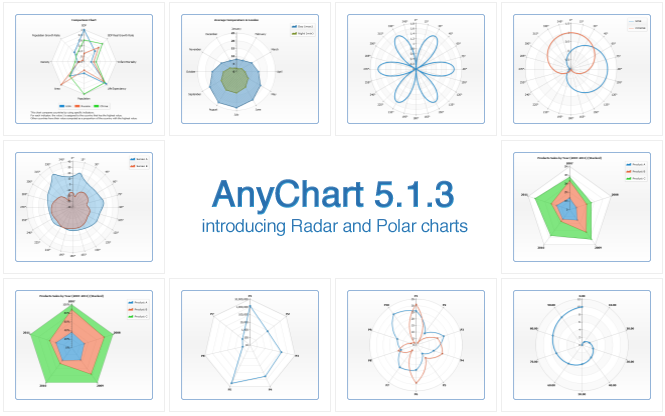
New chart types
- Radar Chart
A radar chart is a graphical method of displaying multivariate data. Variables are represented on axes starting from the same point, where the relative position and angle of the axes is uninformative. It is also known as spider chart, star chart, kiviat diagram, etc. AnyChart allows displaying three types of series on radar charts: Line, Area and Marker. - Polar Chart
A polar chart is a plot drawn on a circular grid, showing trends in values on the basis of angles: each point on a plane is determined by a distance from a fixed point and an angle from a fixed direction. AnyChart allows drawing Line, Area and Marker series on polar plots.
New features
- A new external method that allows animating updated values.
- New formatting keywords that allow controlling the number of characters in token: maxChar and maxCharFinalChars.
- New parameters in chartMouseMove, pointMouseOut, pointMouseOver events: mouseX and mouseY.
- Multiseries pie and donut charts can now use outside labels with connectors.
Bug fixes
- Minor missing values interpolation algorithm issue is fixed.
- Flex component “tooltip stick” problem is solved.
- Wrong positioning of labels for points with zero value is fixed.
Download AnyChart 5.1.3: https://www.anychart.com/download/
Version history: http://6.anychart.com/products/anychart7/history/
- Categories: AnyChart Charting Component
- No Comments »
AnyStock 1.3.0 Available
July 1st, 2011 by Margaret SkomorokhToday, AnyChart Stock and Financial Charts 1.3.0 is available. In the new version, several important improvements have been made:
New technical indicators
New features
- Ability to bind Y-Axis markers to series values to display chart data on the axis. Read more about this feature in User’s Guide article: Y-Axis Markers: Binding to series values.
- Ability to get data set content using the getDataSetCSV() method. You can see how it works in the following example: Online HTML/JS Sample Center: Exporting CSV data.
- A new method getCurrentYAxisInfo() that allows getting scale minimum, maximum and interval values when they are calculated automatically.
Bug fixes
- Grouping of data provider fields with “High” and “Low” approximation types was incorrect.
- Volume+MA indicator worked improperly with ma_period attribute. This error has been fixed.
Download AnyStock 1.3.0: https://www.anychart.com/download/
Version history: http://6.anychart.com/products/anystock7/history/
Roadmap: http://6.anychart.com/products/anystock7/roadmap/
- Categories: AnyStock
- No Comments »