How to Make Mekko Chart Using JavaScript
November 27th, 2023 by Awan Shrestha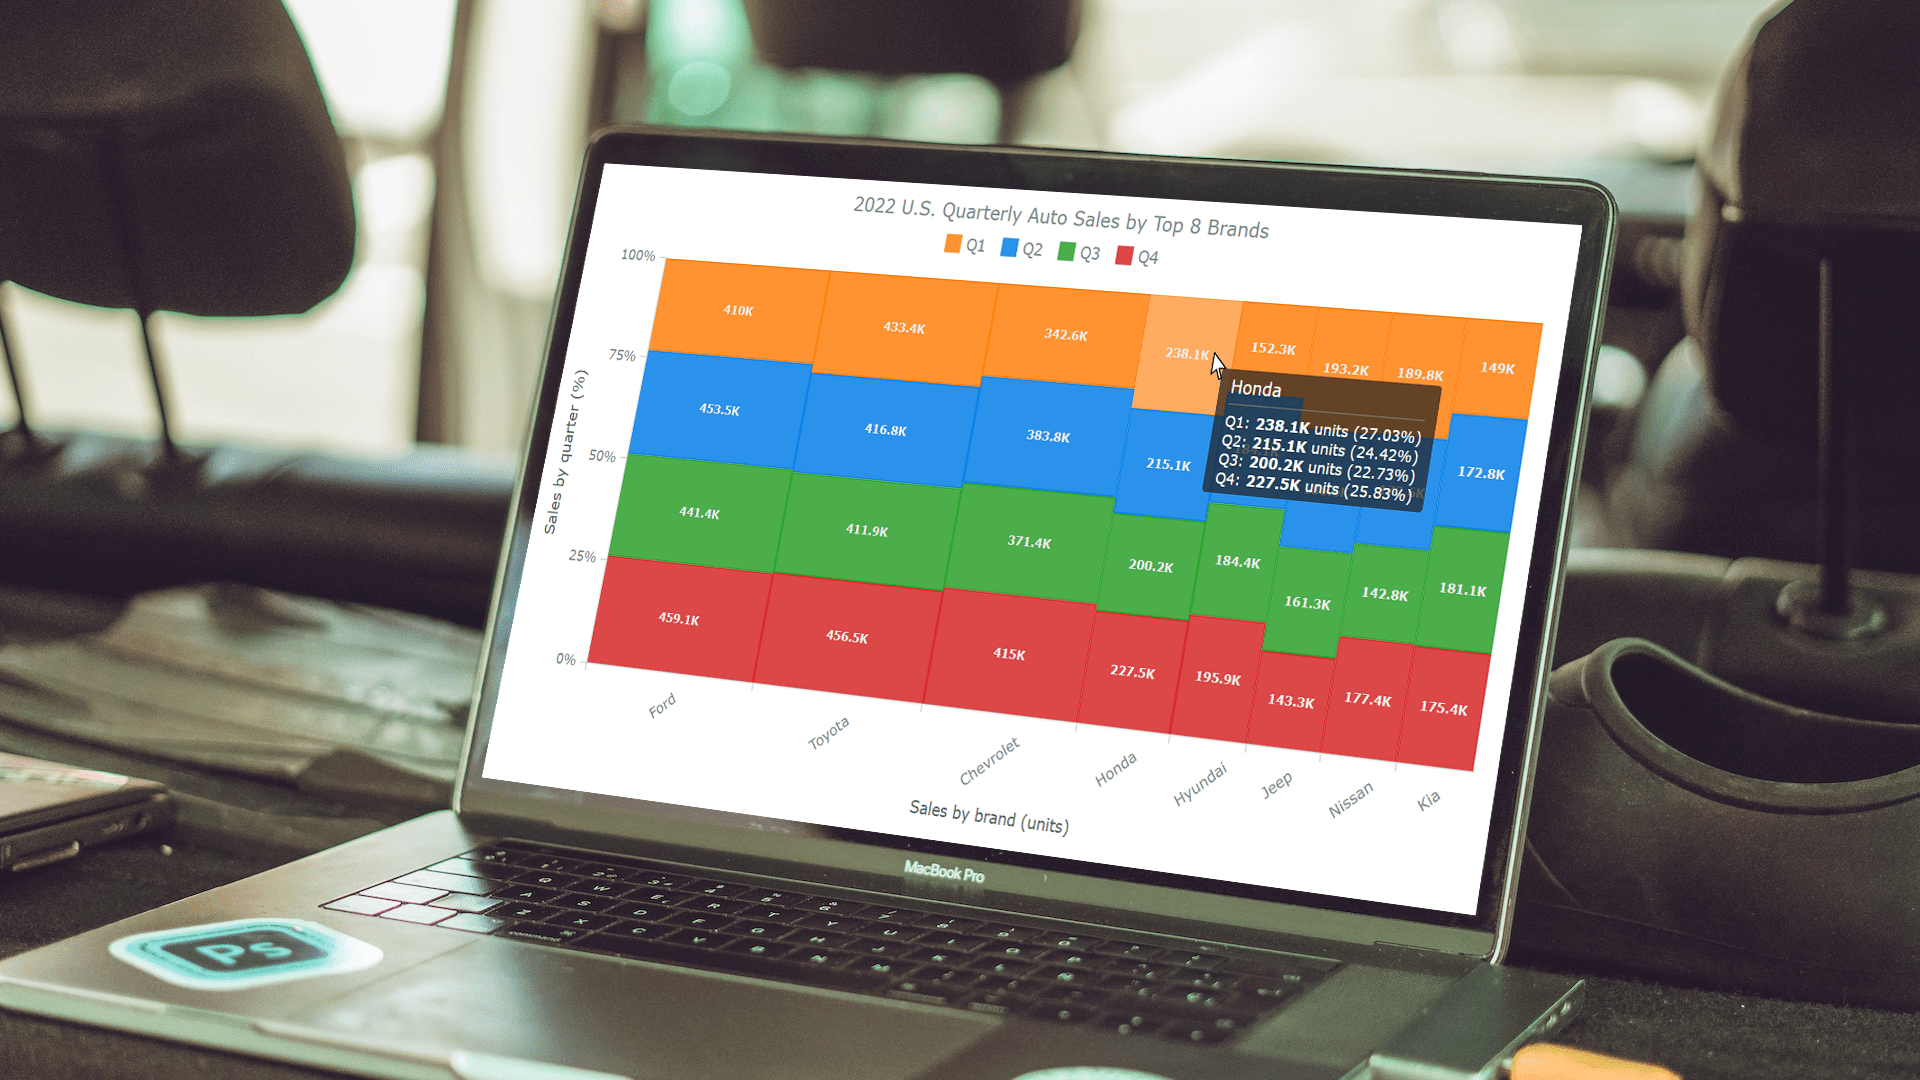 Data visualization plays a pivotal role in comprehending complex information and conveying insights clearly. Among the diverse array of techniques, the Mekko chart stands out for its ability to vividly represent categorical data and illuminate relationships between categories and subcategories.
In this tutorial, we will delve into the world of Mekko charts. First, let’s take a moment to explore what they are and how they function. Then, we’ll get to the focal point, a step-by-step guide on how to quickly create a Mekko chart using JavaScript.
The data used for illustration is the U.S. car sales data for the top eight car brands in 2022. By the end of this tutorial, you will have crafted a cool interactive JS Mekko chart that graphically represents the respective proportions within this data by brand and by quarter.
So, ignite your data visualization engines, and let’s go!
Read the JS charting tutorial »
- Categories: AnyChart Charting Component, HTML5, JavaScript, JavaScript Chart Tutorials, Tips and Tricks
- No Comments »
OHLC Chart: Understanding & Creating in JavaScript Step-by-Step
November 13th, 2023 by Awan Shrestha Unearthing insights from vast datasets is an intricate blend of art and science. In the realm of financial analysis, a pivotal instrument for visually exploring complex data is the Open-High-Low-Close (OHLC) chart. This tutorial is your roadmap to swiftly crafting your OHLC chart using JavaScript, a step-by-step journey. We’ll harness S&P 500 data, and by the end of this article, you’ll possess the skills to orchestrate visual stock analysis adeptly.
Read the JS charting tutorial »
- Categories: AnyChart Charting Component, AnyStock, Big Data, Business Intelligence, Financial Charts, HTML5, JavaScript, JavaScript Chart Tutorials, Stock Charts, Tips and Tricks
- No Comments »
Building Waterfall Charts in JS
November 2nd, 2023 by Awan Shrestha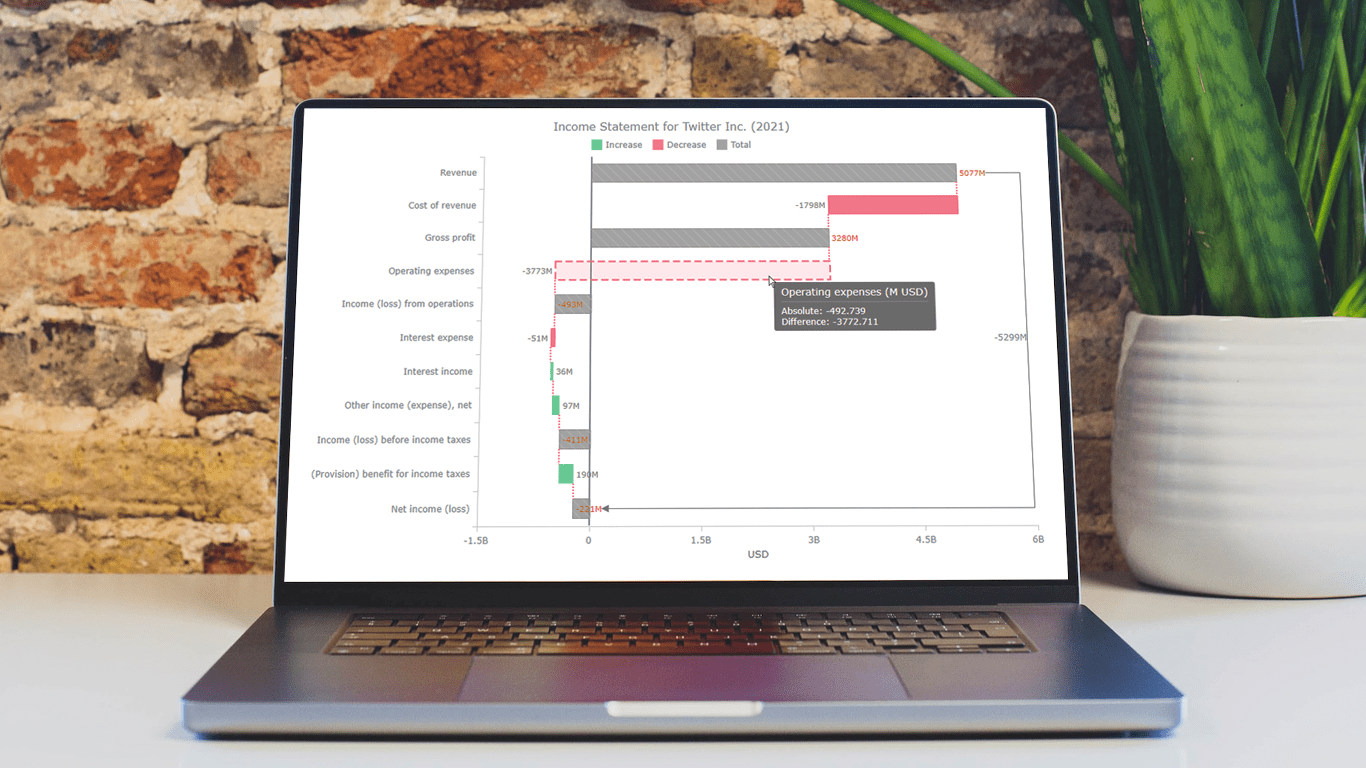 Data visualization is an essential tool for understanding complex data sets and effectively conveying insights. Among the various types of charts and graphs used for this purpose, the waterfall chart stands out as a powerful way to represent changes in financial data, such as revenue, expenses, and profits over a specific period.
In this tutorial, we'll explore how to create a waterfall chart using JavaScript. To illustrate the process, we'll use the example of an income statement for a company, in this case, Twitter Inc.’s latest (and last) one.
Whether it’s to analyze a company's financial performance, project budgets, or inventory fluctuations, this step-by-step guide will help you easily create a useful interactive JS-based waterfall chart.
Read the JS charting tutorial »
- Categories: AnyChart Charting Component, Big Data, Business Intelligence, HTML5, JavaScript, JavaScript Chart Tutorials, Tips and Tricks
- No Comments »