How to Code JS Column Chart with Multi-Level X-Axis — Challenge AnyChart!
April 17th, 2019 by Irina Maximova We continue to update the Challenge AnyChart! section of our blog with new data visualization tutorials. They nicely demonstrate how powerful our JavaScript charting library is, which our Support Team is always eager to prove to everyone. In one of the first challenges, we already told you how to create a JS chart with nested axes. Since our customers keep showing interest in such forms of data presentation, now we’ll show you how to build another interesting chart with a different appearance but quite similar code — an interactive JS column chart with a multi-level X-axis.
- Categories: AnyChart Charting Component, Challenge AnyChart!, HTML5, JavaScript, Tips and Tricks
- No Comments »
Stacked Column Charts with Images — Challenge AnyChart!
January 23rd, 2019 by Irina Maximova We are ready to share a new advanced JS (HTML5) data visualization tutorial. Tasks we get from our customers are always interesting, and the Challenge AnyChart! series on our blog proved to be a great way to show you some of the most compelling ones and explain how to solve them, demonstrating the power and flexibility of our JavaScript charts library. Today’s challenge is about adding images to stacked column charts using AnyChart.
- Categories: AnyChart Charting Component, Challenge AnyChart!, Charts and Art, HTML5, JavaScript, Tips and Tricks
- No Comments »
Custom WiFi Polar Chart in JavaScript — Challenge AnyChart!
January 2nd, 2019 by Irina Maximova Solving challenges is a thing that the AnyChart team can’t live without, and we willingly continue to share some of the most interesting customer cases within the framework of Challenge AnyChart! on our blog. This feature gives us a great chance to help customers with similar tasks and demonstrate the unlimited data visualization capabilities of our JavaScript charting library time after time. The challenge being solved along today’s tutorial is about building a beautiful WiFi polar chart — a custom interactive JS (HTML5) polar chart that displays devices depending on the WiFi signal strength.
- Categories: AnyChart Charting Component, Challenge AnyChart!, Charts and Art, HTML5, JavaScript, Tips and Tricks
- No Comments »
Current Price Indicator with Custom Value and Scale Calculation in JavaScript Stock Charts — Challenge AnyChart!
September 19th, 2018 by Irina Maximova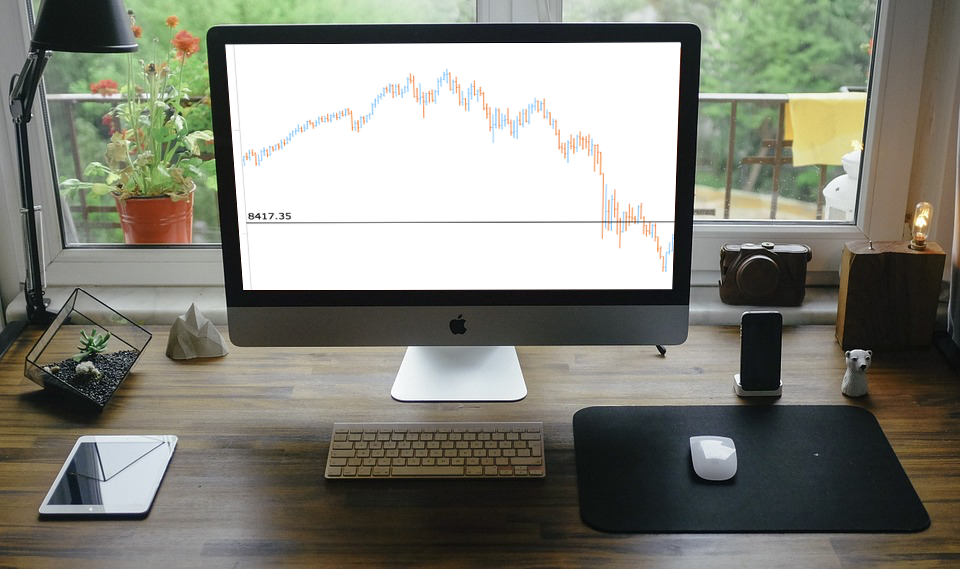 Further inspired by noteworthy questions our Support Team receives from customers, we resume the Challenge AnyChart! feature, demonstrating huge flexibility of our JavaScript (HTML5) charting libraries and explaining how exactly you can solve advanced data visualization tasks with the help of AnyChart. Today’s tutorial is about JS stock charts, and more precisely, we’ll dive into how to draw the Current Price Indicator with a custom value and make it visible even when zooming and scrolling, by utilizing Axis Markers.
- Categories: AnyChart Charting Component, AnyStock, Big Data, Business Intelligence, Challenge AnyChart!, Charts and Art, Financial Charts, HTML5, JavaScript, Stock Charts, Tips and Tricks
- No Comments »
Creating Half Polar Chart with JavaScript — Challenge AnyChart!
May 2nd, 2018 by Irina Maximova
Challenges are always fun, and we at AnyChart adore taking them up from our customers. AnyChart Support Team is happy to show how flexible AnyChart JS Charts are. Today’s Challenge AnyChart tutorial is about JS polar charts. Spend about 5 minutes and you’ll find out how to draw a beautiful polar chart, but display only its one half, making it a half polar chart.
- Categories: AnyChart Charting Component, Challenge AnyChart!, Charts and Art, HTML5, JavaScript, Tips and Tricks
- No Comments »
Custom Technical Indicators in JavaScript Stock Charts — Challenge AnyChart!
March 14th, 2018 by Irina Maximova
It is a pleasure to present a new Challenge AnyChart article! We love our customers and their original tasks, so we continue to show the unlimited capabilities of our JavaScript charting libraries to the blog readers.
The heroes of today’s tutorial are custom technical indicators. Below we’ll explore how to add them to a JS (HTML5) stock chart step by step. So, let’s begin.
- Categories: AnyChart Charting Component, AnyStock, Big Data, Business Intelligence, Challenge AnyChart!, Charts and Art, Financial Charts, HTML5, JavaScript, Stock Charts, Tips and Tricks
- 1 Comment »
Conditional Custom Drawing in JavaScript Charts — Challenge AnyChart!
December 13th, 2017 by Vitaly Radionov The time has come for a new Challenge AnyChart! article! We continue to receive interesting data visualization tasks from our wonderful customers and are happy to share with our blog readers how to solve some of the most inspiring ones with the help of our JavaScript charting libraries.
In today’s tutorial, let’s dig into custom drawing and create an interactive HTML5 line chart of which the segments with negative values are painted with a different color than the rest of the graph.
- Categories: AnyChart Charting Component, Challenge AnyChart!, Charts and Art, HTML5, JavaScript, Tips and Tricks
- No Comments »
How to Add Multi-level Category Axis — Challenge AnyChart!
November 29th, 2017 by Vitaly Radionov We are glad to present to you a new article in the Challenge AnyChart! series.
Just to remind you, these are articles inspired by your requests to our Support Team and our will to publicly prove that the opportunities of interactive data visualization with our JavaScript (HTML5) charting libraries are profound.
One of our customers asked us how to add a multi-level category axis for categorical data and display subcategories. Ok, there you go! We’ve made a quick tutorial and created the corresponding JavaScript chart example (you can already see it in the title picture).
- Categories: AnyChart Charting Component, Challenge AnyChart!, Charts and Art, HTML5, JavaScript, Tips and Tricks
- 1 Comment »
Advanced Visualization of Spot in JS Polar Charts — Challenge AnyChart!
October 27th, 2017 by Vitaly Radionov Meet Challenge AnyChart, a brand new feature on our blog that every dataviz engineer will fall in love with! Each article in this series will be a quick tutorial on how to complete a specific data visualization task that – at first sight – seems too complicated or even unsolvable with AnyChart JS Charts.
From now on, once in a couple of weeks, we’ll pick a thrilling challenge – one of those you’ve shared with our Support Team. And then we’ll show you the best way to deal with it. So all of you can see: Nothing is impossible in AnyChart!
The first challenge for the very first Challenge AnyChart issue is about making an advanced interactive visualization of the spot in a JavaScript polar chart.
- Categories: AnyChart Charting Component, Challenge AnyChart!, Charts and Art, HTML5, JavaScript, Tips and Tricks
- No Comments »