 Meet Challenge AnyChart, a brand new feature on our blog that every dataviz engineer will fall in love with! Each article in this series will be a quick tutorial on how to complete a specific data visualization task that – at first sight – seems too complicated or even unsolvable with AnyChart JS Charts.
From now on, once in a couple of weeks, we’ll pick a thrilling challenge – one of those you’ve shared with our Support Team. And then we’ll show you the best way to deal with it. So all of you can see: Nothing is impossible in AnyChart!
The first challenge for the very first Challenge AnyChart issue is about making an advanced interactive visualization of the spot in a JavaScript polar chart.
Data Visualization Task
The task for this challenge is as follows:
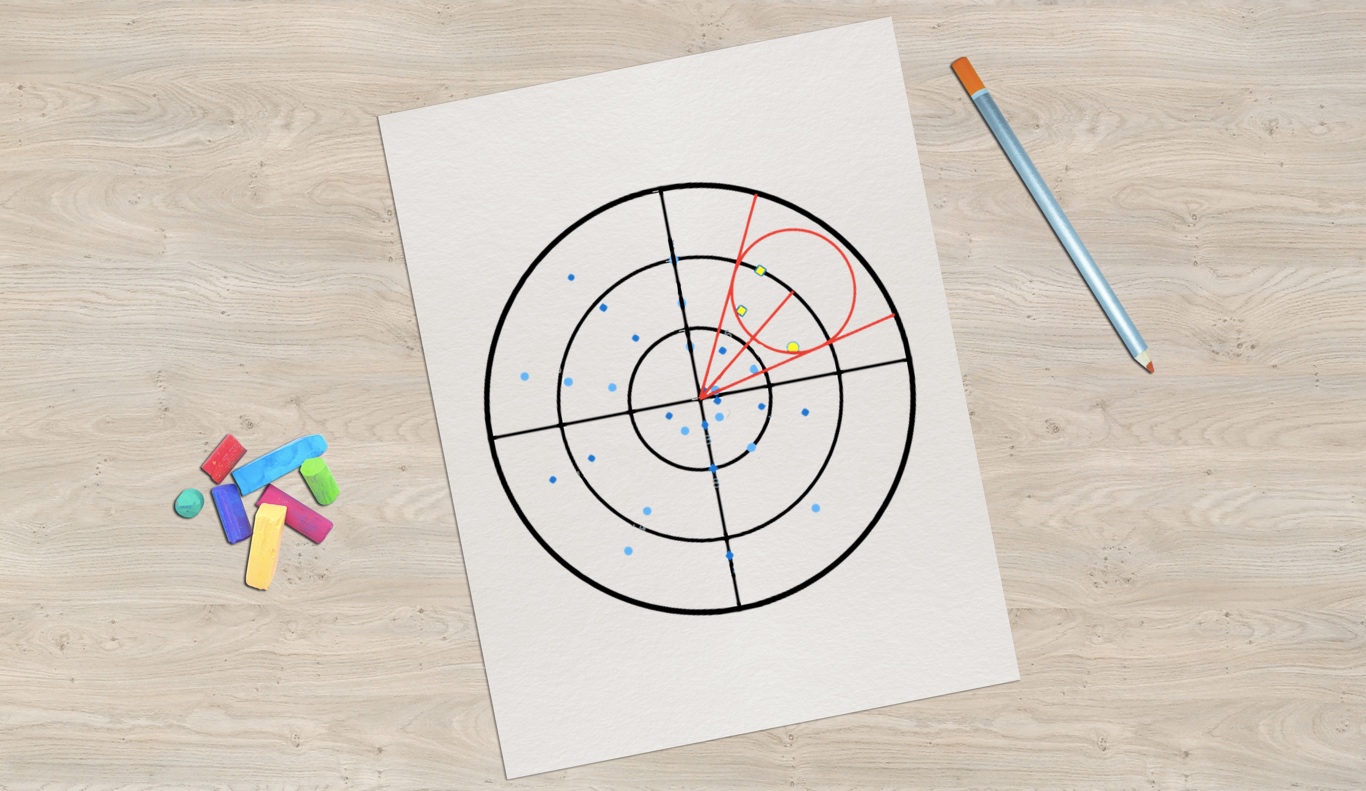
How to visualize the borders of the spot and its tangent lines drawn from the center of a polar chart in the bySpot interactivity mode to highlight markers on the polar lines by area.
Take a look at the target picture:
And right now let’s see how to easily get such a great interactive data visualization with AnyChart!
To solve this task, we need the following:
- a few mathematical calculations;
- methods from the API of AnyChart JS Charts;
- methods from the API of GraphicsJS, the graphics engine in AnyChart.
Set Basic bySpot Interactivity
First things first – let’s configure the interactive features of the JS polar chart according to the task.
You can learn how to work with the bySpot mode from the chart documentation.
chart.interactivity({hoverMode: 'by-spot', spotRadius: 60});Add Event Listeners
Now that we’ve added the bySpot interactivity to the chart, let’s proceed to create custom event listeners.
We’ll set them in two steps.
First, we assign listeners to the mouseMove and mouseOut events. The functions – drawSpotHandler и clearSpotHandler – can be defined later.
The second step is – we need to provide the polar chart with a listener to the pointsHover event that is activated when a point of the chart gets into the spot or leaves its boundaries, i.e. turns into or off the hover state.
That’s the right moment to get and store the array of all such current points and process them in the drawSpotHandler listener.
chart.listen('mouseMove', drawSpotHandler);
chart.listen('mouseOut', clearSpotHandler);

chart.listen('pointsHover', function (e) { ...
Custom Handlers
Let’s decide what we need to do in the custom handlers.
- They must work only when the mouse cursor is over the plot.
- The spot must be visualized only in the bySpot mode (so that nothing gets broken when the chart interactivity mode is switched to a different one).
- Such a visualization must be enabled only for Radar and Polar chart types (according to the request of AnyChart’s customer who submitted this challenge).
Adjust Visualization
Finally, we need to configure visualization.
The main idea here is to draw several elements with the help of the GraphicsJS JavaScript library:
- circle to visualize the spot;
- line from the center of the chart to the center of the circle;
- two tangent lines from the center of the chart with the length of both equaling the chart radius.
In order to implement that, we need to calculate the following:
- coordinates of the center of the chart;
- coordinates of the mouse cursor which will be the center of the spot;
- angles between the tangent lines and the circle;
- points of intersection between the tangent lines and the chart’s edge (to make sure the length of the lines equals the radius of the polar chart).
The resulting data will allow us to add the graphical features we are looking for.
Once the mouse cursor leaves the data plot, the spot visualization needs to be removed. That can be easily implemented with the help of another handler.
function clearSpotHandler(e) {
    if (this.spotCircle) this.spotCircle.parent(null);
}
That’s it! Take a look at the interactive JavaScript (HTML5) polar chart that fully corresponds to the terms of the challenge: Visualizing the borders of the spot and its tangent lines drawn from the center of a polar chart in the bySpot interactivity mode to highlight markers on the polar lines by area.
See the Pen <a href=”https://codepen.io/Radionov/pen/mBYvqo/”>Spot’s Visualization</a> by Vitaly (<a href=”https://codepen.io/Radionov”>@Radionov</a>) on <a href=”https://codepen.io”>CodePen</a>.
Here’s the full code of the resulting polar chart:
anychart.onDocumentReady(function () {
  // create a polar chart
  chart = anychart.polar();

  // set interactivity
  // hoverMode: by-spot – mode to apply interactivity to points within radius
  // spotRadius – spot radius setting
  chart.interactivity({hoverMode: 'by-spot', spotRadius: 40});

  // add chart listeners
  chart.listen('mouseMove', drawSpotHandler);
  chart.listen('mouseOut', clearSpotHandler);
  // create an array to store the points currently hovered
  var currentPoints = [];
  chart.listen('pointsHover', function (e) {
    // the pointsHover event is triggered before the mouseMove event
    // so we can get a list of all hovered points at this time
    if (!e.currentPoint.hovered)
      return; // quit if the hover state is already active
    // store the current set to a variable
    currentPoints = e.points;
  });

  // adjust the tooltip to display all points within the spot
  var tooltip = chart.tooltip();
  // collect data from all series
  tooltip.displayMode('union');
  // create the tooltip body
  tooltip.unionFormat(function (e) {
    var result = [];
    // store the series, current X and value – for each point
    for (var i = 0, len = currentPoints.length; len > i; i++) {
     result.push("(" + currentPoints[i].getSeries().name() + ') ' + currentPoints[i].get('x') + ': ' + currentPoints[i].get('value'))
    }
    return result.join('\n');
  });

  // enable labels for all series
  chart.labels().enabled(true);

  // create a series
  var series1 = chart.line([ [1, 2], [2, 3], [3, 4], [4, NaN], [0, 6], [1, 7], [2, 8], [3, NaN], [4, 10], [0, 11], [1, 12], [2, NaN], [3, 14], [4, 15], [0, 16], [1, NaN], [2, 18], [3, 19], [4, 20] ]);
  // create the second series
  var series2 = chart.line([ [0.5, 1], [1.5, 2], [2.5, 3], [3.5, 4], [4.5, NaN], [0.5, 6], [1.5, 7], [2.5, 8], [3.5, NaN], [4.5, 10], [0.5, 11], [1.5, 12], [2.5, NaN], [3.5, 14], [4.5, 15], [0.5, 16], [1.5, NaN], [2.5, 18], [3.5, 19], [4.5, 20] ]);

  // configure settings for hovered points
  series1.hovered().markers().fill('yellow');
  series2.hovered().markers().fill('yellow');

  // create a container and draw
  chart.container('container').draw(); });
  /**
  * function to visualize the spot
  * @param e Event
  */
  function drawSpotHandler(e) {
  // quit if the legend is hovered
  if (e['target'].paginator) { return null; }

  // check whether the interactivity settings have been changed
  var interactivity = this.interactivity();

  // quit if the interactivity mode is not bySpot
  if (interactivity.hoverMode() != 'by-spot') return null;

  // draw the visualization only if the chart type is radar or polar
  if (this.getType() == 'polar' || this.getType() == 'radar') {

    // store the radius settings in a variable
    var spotRadius = interactivity.spotRadius();

    // store the DIV element in which the chart is drawn in a variable
    var containerDivElement = this.container().container(); // calculate coordinates of the mouse cursor
    var x = e['clientX'] - (containerDivElement.offsetLeft - (document.scrollLeft || 0));
    var y = e['clientY'] - (containerDivElement.offsetTop - (document.scrollTop || 0));

    // calculate dimensions of the data plot
    var dataBounds = this.xAxis().getRemainingBounds();

    // calculate coordinates of the center and the radius of the radar or polar line
    var radius = Math.min(dataBounds.width, dataBounds.height) / 2;
    var cx = Math.round(dataBounds.left + dataBounds.width / 2);
    var cy = Math.round(dataBounds.top + dataBounds.height / 2);

    // check whether the mouse cursor is still within the chart radius
    var clientRadius = Math.sqrt(Math.pow(cx - x, 2) + Math.pow(cy - y, 2));
    // if outside, clean up the visualization
    if (clientRadius > radius) {
      if (this.spotCircle) this.spotCircle.parent(null);
      if (this.centerLine) this.centerLine.clear();
      if (this.leftLine) this.leftLine.clear();
      if (this.rightLine) this.rightLine.clear();
      return null;
    }

    // if no spot exists, draw it
    if (!this.spotCircle) {
      this.spotCircle = anychart.graphics.circle();
      this.spotCircle
          .radius(spotRadius)
          .stroke('black .5');
    }
    // if the spot has no parent, assign it
    if (!this.spotCircle.hasParent())
      this.spotCircle.parent(this.container());

    // put the spot center to the current mouse coordinates
    this.spotCircle.centerX(x).centerY(y);

    // create the central line if it does not exist
    if (!this.centerLine)
      this.centerLine = this.container().path().zIndex(1000).stroke('black .2').disablePointerEvents(true);

    // draw a line segment from center
    this.centerLine.clear().moveTo(cx, cy).lineTo(x, y);

    // calculate tangent lines from the center of the radar or polar chart
    var dx, dy, angle;
    var leftSideRatio, rightSideRatio;
    if (clientRadius - spotRadius >= 0) {
      dx = cx - x;
      dy = cy - y;

      angle = Math.atan(dx / dy);
      if (angle <= 0)
        angle += Math.PI;
      if (dx < 0 || (angle == Math.PI && dy > 0))
        angle += Math.PI;
      angle += this.startAngle();

      var dAngle = Math.asin(spotRadius / clientRadius);
      var leftSideAngle = angle + dAngle;
      var rightSideAngle = angle - dAngle;

      leftSideRatio = 1 - (leftSideAngle / (Math.PI * 2));
      rightSideRatio = 1 - (rightSideAngle / (Math.PI * 2));

      var leftA = (this.startAngle() - 90 + 360 * leftSideRatio) * Math.PI / 180;
      var rightA = (this.startAngle() - 90 + 360 * rightSideRatio) * Math.PI / 180;

      if (!this.leftLine) this.leftLine = this.container().path().zIndex(1000).stroke('black .2');
      this.leftLine.clear().moveTo(cx, cy).lineTo(cx + radius * Math.cos(leftA), cy + radius * Math.sin(leftA));

      if (!this.rightLine) this.rightLine = this.container().path().zIndex(1000).stroke('black .2');
      this.rightLine.clear().moveTo(cx, cy).lineTo(cx + radius * Math.cos(rightA), cy + radius * Math.sin(rightA));
    } else {
      // tangent lines are not drawn if the center of the radar or polar line is within the spot
      if (this.leftLine) this.leftLine.clear();
      if (this.rightLine) this.rightLine.clear();
    }
  }
}

/**
 * function to remove the visualization of the spot once the mouse cursor leaves the data plot
 * @param e
 */
function clearSpotHandler(e) {
  if (this.spotCircle) this.spotCircle.parent(null);
}
If you want to test the capabilities of the AnyChart JS Charts component with an interesting data visualization task, or if you have any doubt that our JavaScript charting libraries can do every particular thing that our competitors have (and even more!) – simply contact us at support@anychart.com with “Challenge” in the subject of your email. We’ll show you a relevant solution in detail and possibly share it with the others in one of our next Challenge AnyChart posts, so that could also be your great contribution to the community!
Believe us, all is possible with AnyChart! You’ll learn how.
- Categories: AnyChart Charting Component, Challenge AnyChart!, Charts and Art, HTML5, JavaScript, Tips and Tricks
- No Comments »