 The time has come for a new Challenge AnyChart! article! We continue to receive interesting data visualization tasks from our wonderful customers and are happy to share with our blog readers how to solve some of the most inspiring ones with the help of our JavaScript charting libraries.
In today’s tutorial, let’s dig into custom drawing and create an interactive HTML5 line chart of which the segments with negative values are painted with a different color than the rest of the graph.
Data Visualization Task
To be more precise, we’ll look into the following situation as requested by one of our customers.
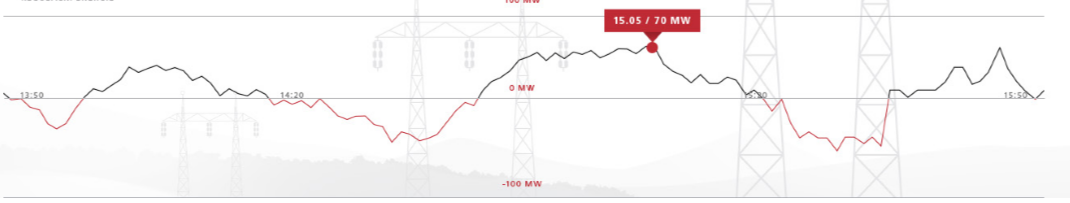
Here’s the kind of Line Chart we need: When the data goes to negative values, the color of the line must change to red and the crossing point between the graph and the X-axis must feature a timestamp displayed. Is it possible to do it in AnyChart JS Charts?
Below is the picture that the customer attached to illustrate the data visualization task and show us what chart exactly was needed:
To create a data visualization solution according to this task, we need to use the following:
- the Custom Drawing feature of the AnyChart JavaScript charting library;
- the axis marker line (for the zero line);
- a few mathematical calculations.
Solution Overview
To display a chart like this we need to change the function that is responsible for drawing a line in Line Charts.
We need to get two sets of line segments, one with all the points above zero and the other with all the points with negative values. Each line segment will be connected with others from the same set or with an additional point on the zero line.
Basic math will help us create a set of additional points – intersections between the series line and the zero line (a set of X values where Y equals 0).
Custom Drawing
You can learn about the customization of the series drawing functions in the dedicated section of our chart documentation.
The custom drawing function works with point coordinates and 0 on the Y-axis for the current point. This means we only need to calculate X and draw line segments each of which will be colored according to its value.
var zeroX = (this.zero - context.prevY) / (this.value - context.prevY) * (this.x - context.prevX) + context.prevX;Different Colors
Each series has methods that can’t be used. For example, a simple line series uses the stroke() method but it doesn’t use lowStroke().
Let’s use lowStroke() to set the color for the negative part of the chart.
series.lowStroke('red');Then, when creating a custom shape, we will specify that the color for negative segments comes from the value set with the lowStroke.
strokeName: 'lowStroke',Here’s the result we’ve got:
See the Pen Series Conditional Draw by Vitaly (@Radionov) on CodePen.
Check out the full code of the chart:
anychart.onDocumentReady(function () {

    // create data
    var data = [
        {x: Date.UTC(2014, 5, 6, 1, 15, 0), value: -10},
        {x: Date.UTC(2014, 5, 6, 6, 30, 0), value: 15},
        {x: Date.UTC(2014, 5, 6, 12, 45, 0), value: 5},
        {x: Date.UTC(2014, 5, 6, 19, 20, 0), value: 45},
        {x: Date.UTC(2014, 5, 6, 22, 0, 0), value: 25},
        {x: Date.UTC(2014, 5, 7, 2, 5, 0), value: -12},
        {x: Date.UTC(2014, 5, 7, 7, 25, 0), value: -13},
        {x: Date.UTC(2014, 5, 7, 13, 45, 0), value: 4},
        {x: Date.UTC(2014, 5, 7, 20, 5, 0), value: 43},
        {x: Date.UTC(2014, 5, 7, 23, 15, 0), value: 23},
        {x: Date.UTC(2014, 5, 8, 2, 5, 0), value: -20}
    ];

    // create a chart
    var chart = anychart.line();

    //set the DateTime type of scale
    chart.xScale(anychart.scales.dateTime());

    //set the zero line by yAxis
    var zeroLine = chart.lineMarker();
    zeroLine.value(0);
    zeroLine.stroke("2 grey");

    // create a spline series and set the data
    var series = chart.line(data);

    // point settings
    setupDrawer(series, chart);
    // set the red stroke for line segments below the zero line
    series.normal().lowStroke('red');

    // tooltip settings
    chart.tooltip({
        titleFormat: function () {
            return anychart.format.dateTime(this.x, "dd MMMM HH:mm");
        },
        format: "Value: {%Value}"
    });

    chart.container('container');
    chart.draw();

    /**
     * Custom series drawing function
     * @param series - current series
     * @param chart - current chart
     */
    function setupDrawer(series, chart) {
        var xAxis = chart.xAxis();

        // array for standalone labels and counter
        var zeroLabels = [];

        // remove old current labels when resizing the container
        window.onresize = function () {
            var label;
            while (label = zeroLabels.pop()) label.dispose();
        };

        // add the second shape for the line path below the zero line
        var tmp = series.rendering().shapes();
        tmp.push({
            name: 'negative',
            shapeType: 'path',
            fillName: null,
            strokeName: 'lowStroke',
            isHatchFill: false,
            zIndex: 1
        });

        // create a context for how each point will be drawn
        var context = {
            series: series,
            prevPointDrawn: false,
            prevWasNegative: false,
            prevX: null,
            prevY: null
        };

        var customRenderer = series.rendering();
        customRenderer.needsZero(true);
        customRenderer.shapes(tmp);
        customRenderer.start(function () {
            context.prevPointDrawn = false;
        });
        var customPointDrawer = function () {
            if (this.missing) {
                context.prevPointDrawn = context.prevPointDrawn && context.series.connectMissing();
            } else {
                // get a shape depending on a point's state
                var shapes = this.getShapesGroup(this.seriesState);
                // set what point is negative
                var isNegative = this.getDataValue('value') < 0;
                // determine the path of the current point to continue drawing
                var currPath = isNegative ? shapes['negative'] : shapes['stroke'];
                if (context.prevPointDrawn) {
                    // enter only if the plus-minus nature has changed
                    if (isNegative != context.prevWasNegative) {
                        // determine the path of the previous point to continue drawing
                        var prevPath = context.prevWasNegative ? shapes['negative'] : shapes['stroke'];
                        // determine the position of 0 (by X)
                        var zeroX = (this.zero - context.prevY) / (this.value - context.prevY) * (this.x - context.prevX) + context.prevX;
                        // draw the previous point from zero
                        prevPath.lineTo(zeroX, this.zero);
                        // draw the current point from zero
                        currPath.moveTo(zeroX, this.zero);

                        var localCoordinates = chart.globalToLocal(zeroX, this.zero);
                        var ratio = (localCoordinates.x - xAxis.getPixelBounds().left ) / xAxis.getPixelBounds().width;
                        var time = chart.xScale().inverseTransform(ratio);

                        // draw a label for the crossing between the series line and the zero line
                        var zeroLbl = anychart.standalones.label();
                        zeroLbl.text(anychart.format.dateTime(time, "HH:mm"));
                        zeroLbl.offsetX(zeroX);
                        zeroLbl.offsetY(this.zero);
                        zeroLbl.container(chart.container());
                        zeroLbl.draw();
                        zeroLabels.push(zeroLbl);
                    }
                    currPath.lineTo(this.x, this.value);
                } else {
                    // draw the very first point
                    currPath.moveTo(this.x, this.value);
                }
                context.prevX = this.x;
                context.prevY = this.value;
                context.prevWasNegative = isNegative;
                context.prevPointDrawn = true;
            }
        };
        customRenderer.point(customPointDrawer);
    }
});
Have a sophisticated data visualization task? Not sure how to deal with it best or whether it is actually solvable with AnyChart JS Charts? Simply email us all the relevant details at support@anychart.com with "Challenge" in the subject line. Our Support Team will be happy to help you asap and we might even decide to make a tutorial based on your question and share it in one of the next articles!
Indeed, AnyChart can help you cope with any, even complicated and extraordinary data visualization tasks and any custom drawing. We'll continue the Challenge AnyChart! series on our blog to show you how.
- Categories: AnyChart Charting Component, Challenge AnyChart!, Charts and Art, HTML5, JavaScript, Tips and Tricks
- No Comments »