 Further inspired by noteworthy questions our Support Team receives from customers, we resume the Challenge AnyChart! feature, demonstrating huge flexibility of our JavaScript (HTML5) charting libraries and explaining how exactly you can solve advanced data visualization tasks with the help of AnyChart. Today’s tutorial is about JS stock charts, and more precisely, we’ll dive into how to draw the Current Price Indicator with a custom value and make it visible even when zooming and scrolling, by utilizing Axis Markers.
Data Visualization Task
The question a customer wanted us to answer was as follows:
How to visualize the CPI (Current Price Indicator) with a custom value in such a way that it is visible when scrolling or zooming?
In fact, you can make such a stock chart using our AnyStock JavaScript library. In the 8.3.0 release of AnyChart JS Charts, it received the new Axis Marker feature which will be helpful in this case, namely the lineMarker() and textMarker() methods.
Solution Overview
To begin with, draw an open-high-low-close (OHLC) series on the chart.
After that, create a variable with a custom value, pass it to the line and text markers, and make them visible when scrolling and zooming.
Axis Markers
The Axis Markers feature makes it easy to create markers and set them up as you want.
The first thing you need here is to specify a custom value like this:
var markerValue = 8200;
Once the value is set, it should be passed to the marker’s settings:
var lineMarker = plot.lineMarker();
lineMarker
 .value(markerValue)
 .scaleRangeMode('consider');

var textMarker = plot.textMarker();
textMarker
 .text(markerValue)
 .value(markerValue)
The scaleRangeMode(‘consider’) method in the code snippet above makes the marker value considered in the scale calculation, ensuring the marker is visible no matter what data range is selected.
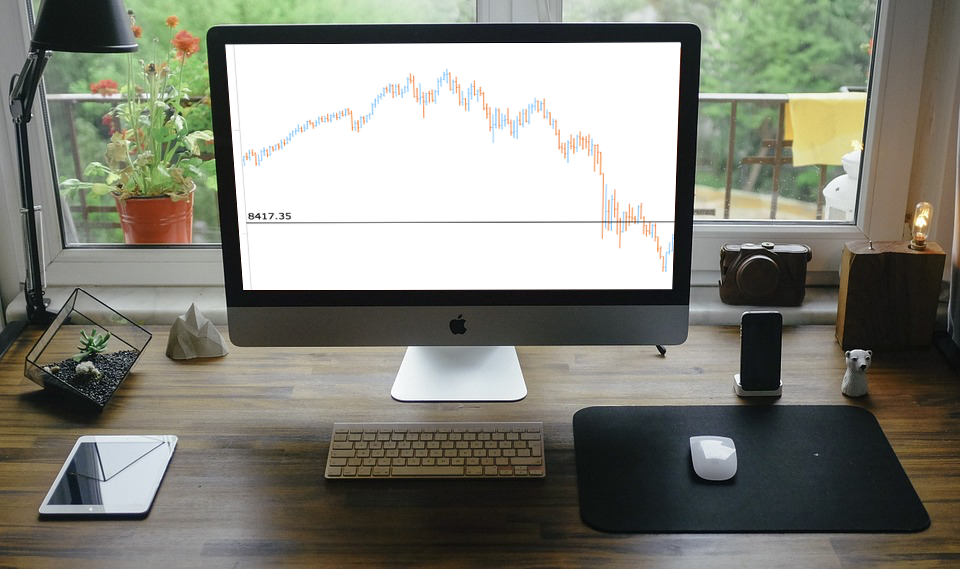
That’s it! Here is a JavaScript (HTML5) stock chart with the custom value-based CPI.
Advanced Visualization of Custom Value-Based Current Price Indicator
Moreover, it is possible to calculate a custom value from data. For example, you can get it as the average of the last 10 ‘close’ values, starting from the last visible one:
// advance the iterator to the next position
    while (iterator.advance()) {
      queue.push(iterator.get("close"));
      // delete all values except the last 10
      if (queue.length > 10) {
        queue.shift();
      }
      var sum = 0;
      // not enough data - don't draw the axis marker
      if (queue.length < 10) {
        value = null;
      }
      else {
        // calculate the marker value
        for (var i = 0;i < queue.length; i++){
          sum = sum + queue[i];
        }
        value = (sum/10).toFixed(2);
      }
    }
    return value;
  }
Since the formula includes only the last 10 values, you should set the maximum and minimum of the X scale so they properly display the value of the Current Price Indicator:
var max = xScale.getMaximum();
var min = xScale.getFullMinimum();
Check out the resulting interactive visualization below. You can modify this JS stock chart sample with the CPI based on a custom value from data to your liking on the AnyChart Playground.
For your reference, the code is written below:
anychart.onDocumentReady(function () {
  // create a data table, load and map the data
  var dataTable = anychart.data.table();
  dataTable.addData(get_dji_daily_short_data());
  var mapping = dataTable.mapAs({'open': 1, 'high': 2, 'low':3, 'close':4});

  // create a stock chart
  var chart = anychart.stock();

  // create a plot
  var plot = chart.plot();

  // create an OHLC series
  plot.ohlc(mapping).name("Price");

  // get the marker value
  var markerValue = getMarkerValue();

  // create a line marker
  var linemarker = plot.lineMarker();
  linemarker
    .value(markerValue)
    .stroke('black', 1)
    .zIndex(100)
    .scaleRangeMode('consider');

  // create a text marker
  var textMarker = plot.textMarker();
  textMarker
    .text(markerValue||'')
    .value(markerValue)
    .align('left')
    .anchor('left-bottom')
    .padding(3)
    .fontColor('black')
    .zIndex(100);

  // display the chart
  chart.container("container").draw();

  // recalculate the axis marker value when scrolling
  chart.scroller().listen("scrollerchange", function (markerValue) {
	// get the new marker value
    markerValue = getMarkerValue();

    // create a line marker
    linemarker.value(markerValue);

    // set the text marker value and text
    textMarker.text(markerValue||'').value(markerValue);
  });

  // get the value for the axis marker
  function getMarkerValue() {
    var xScale = chart.xScale();
    // get the start and end dates
    var max = xScale.getMaximum();
    var min = xScale.getFullMinimum();

    var selectable = mapping.createSelectable();
    // select a date range
    selectable.select(min, max);

    var queue = [];
    var value = null;

    // get the iterator
    var iterator = selectable.getIterator();
    // advance the iterator to the next position
    while (iterator.advance()) {
      queue.push(iterator.get("close"));
      // delete all values except the last 10
      if (queue.length > 10) {
        queue.shift();
      }
      var sum=0;
      // not enough data - don't draw the axis marker
      if (queue.length < 10) {
        value = null;
      }
      else {
        // calculate the marker value
        for (var i = 0;i < queue.length; i++){
          sum = sum + queue[i];
        }
        value = (sum/10).toFixed(2);
      }
    }
    return value;
  }
});
If you have unusual tasks or questions about visualization, please share them with us at support@anychart.com with “Challenge” in the subject line. Our Support Team will be glad to solve them for you, showing the power of flexible AnyChart JS Charts.
We hope this article about drawing the Current Price Indicator with a custom value using the Axis Markers feature in AnyStock is helpful. Feel free to ask any questions, and stay tuned for the next Challenge AnyChart! tutorials on our blog.
- Categories: AnyChart Charting Component, AnyStock, Big Data, Business Intelligence, Challenge AnyChart!, Charts and Art, Financial Charts, HTML5, JavaScript, Stock Charts, Tips and Tricks
- No Comments »