 Data visualization is an essential tool for understanding complex data sets and effectively conveying insights. Among the various types of charts and graphs used for this purpose, the waterfall chart stands out as a powerful way to represent changes in financial data, such as revenue, expenses, and profits over a specific period.
In this tutorial, we'll explore how to create a waterfall chart using JavaScript. To illustrate the process, we'll use the example of an income statement for a company, in this case, Twitter Inc.’s latest (and last) one.
Whether it’s to analyze a company's financial performance, project budgets, or inventory fluctuations, this step-by-step guide will help you easily create a useful interactive JS-based waterfall chart.
Waterfall Chart That Will Be Created
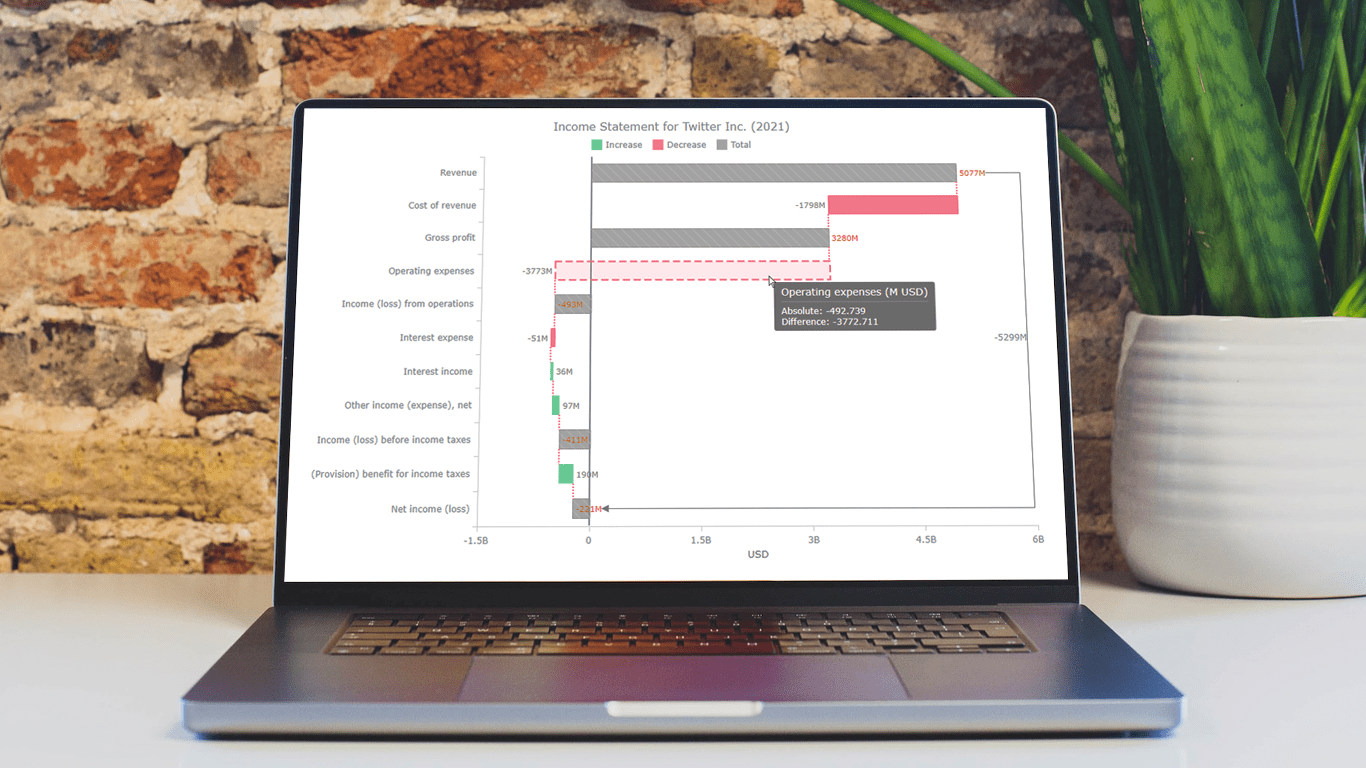
Here’s the JavaScript-based waterfall chart that will be the final visualization of this tutorial. Take a quick look at it, and let’s get started.
A. Creating Basic JS Waterfall Chart
If you're new to creating JS charts, don't worry; it's easier than you think! You can create stunning charts, including waterfall plots, following these four fundamental steps:
- Create a container
- Include the necessary JavaScript files
- Add data to visualize
- Write simple JS charting code
Step 1: Create Container
Begin by setting up a container for your waterfall chart. This involves adding a block-level HTML element to your webpage, defining its id, and specifying its width and height.
This is how your HTML structure could look:
<!DOCTYPE html>
<html lang="en">
  <head>
    <meta charset="utf-8">
    <title>JavaScript Waterfall Chart</title>
    <style>
      html, body, #WaterfallContainer {
        width: 100%;
        height: 100%;
        margin: 0;
        padding: 0;
      }
    </style>
  </head>
  <body>
    <div id="WaterfallContainer"></div>
  </body>
</html>
Step 2: Include Necessary JavaScript Files
Once the container is set up, include the necessary JavaScript files in the <head> section. This tutorial shows how you can use a JS charting library like AnyChart.
Here’s how your HTML might look with the necessary <script> tags included:
<!DOCTYPE html>
<html lang="en">
  <head>
    <meta charset="utf-8">
    <title>JavaScript Waterfall Chart</title>
    <script src="https://cdn.anychart.com/releases/8.11.1/js/anychart-core.min.js"></script>
    <script src="https://cdn.anychart.com/releases/8.11.1/js/anychart-waterfall.min.js"></script>
    <style>
      html, body, #WaterfallContainer {
        width: 100%;
        height: 100%;
        margin: 0;
        padding: 0;
      }
    </style>
  </head>
  <body>
    <div id="WaterfallContainer"></div>
    <script>
      // All the code for the waterfall chart will come here.
    </script>
  </body>
</html>
Step 3: Add Data to Visualize
Next, it's time to add data to visualize. The data for Twitter Inc.'s last income statement (Twitter Inc. no longer exists; the company is now a part of X Corp.) originates from here. For a waterfall chart, you can set the data in many ways; I will include it just like that directly in the code.
Below is an example of a data set, where the data is structured as an array. Each item contains an "x" and "value" fields. The "x" field represents the name of the corresponding item of the income statement, while the "value" field signifies the magnitude of each data point.
var data = [
  { x: "Revenue", value: 5077.482 },
  { x: "Cost of revenue", value: -1797.510 },
  { x: "Gross profit", isTotal: true },
  { x: "Operating expenses", value: -3772.711 },
  { x: "Income (loss) from operations", isTotal: true },
  { x: "Interest expense", value: -51.186 },
  { x: "Interest income", value: 35.683 },
  { x: "Other income (expense), net", value: 97.129 },
  { x: "Income (loss) before income taxes", isTotal: true },
  { x: "(Provision) benefit for income taxes", value: 189.704 },
  { x: "Net income (loss)", isTotal: true }
];
Step 4: Write Simple JS Charting Code
Now, you can easily visualize the data with just a few lines of charting code.
Start by ensuring your code executes only when the page has fully loaded by wrapping it up in a function like the one below.
anychart.onDocumentReady(function () {
  // Your code goes here.
});
Now, it's time to define the data you want to visualize, taking it from the previous step.
anychart.onDocumentReady(function () {

  // set the data
  var data = [
    { x: "Revenue", value: 5077.482 },
    { x: "Cost of revenue", value: -1797.510 },
    { x: "Gross profit", isTotal: true },
    { x: "Operating expenses", value: -3772.711 },
    { x: "Income (loss) from operations", isTotal: true },
    { x: "Interest expense", value: -51.186 },
    { x: "Interest income", value: 35.683 },
    { x: "Other income (expense), net", value: 97.129 },
    { x: "Income (loss) before income taxes", isTotal: true },
    { x: "(Provision) benefit for income taxes", value: 189.704 },
    { x: "Net income (loss)", isTotal: true }
  ];

  // All the next code for the JS waterfall chart will come here.

});
Now that you have your data, create an instance of a waterfall chart. This chart instance will serve as the canvas upon which you'll visualize your data.
var chart = anychart.waterfall()
To add your data to the waterfall chart, create a series object and assign your data to it. The series object is where you define how the data will be represented on the graphic. This step connects your data to the chart and tells it how to display each data point.
var series = chart.waterfall(data);
You may choose to disable data point labels if your values are large and would otherwise clutter the view (all values can still be seen in the tooltip). We will return the labels and customize this and a few other things in the chart later in Section B.
series.labels(false);
You’ve set up your JS waterfall chart, but now it needs a home. Set the ID of the container element in your HTML where the visual will be displayed. This makes your chart aware of where it should appear on your webpage.
chart.container("WaterfallContainer");
Finally, with all the pieces in place, issue the command to draw the resulting waterfall chart.
chart.draw();
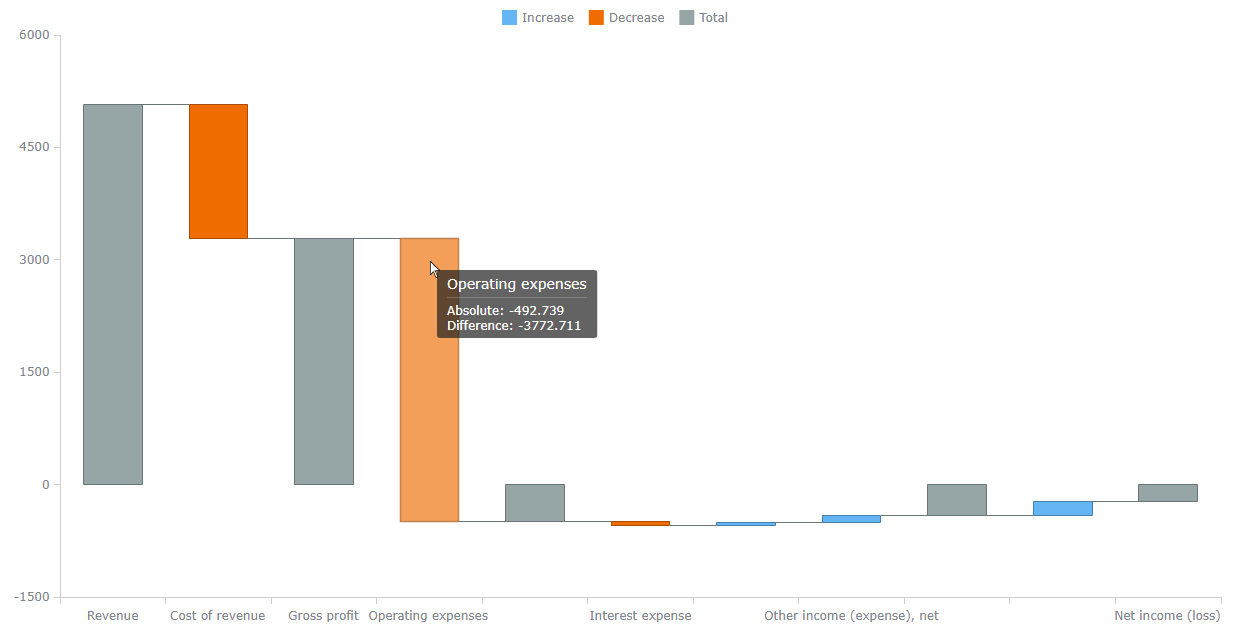
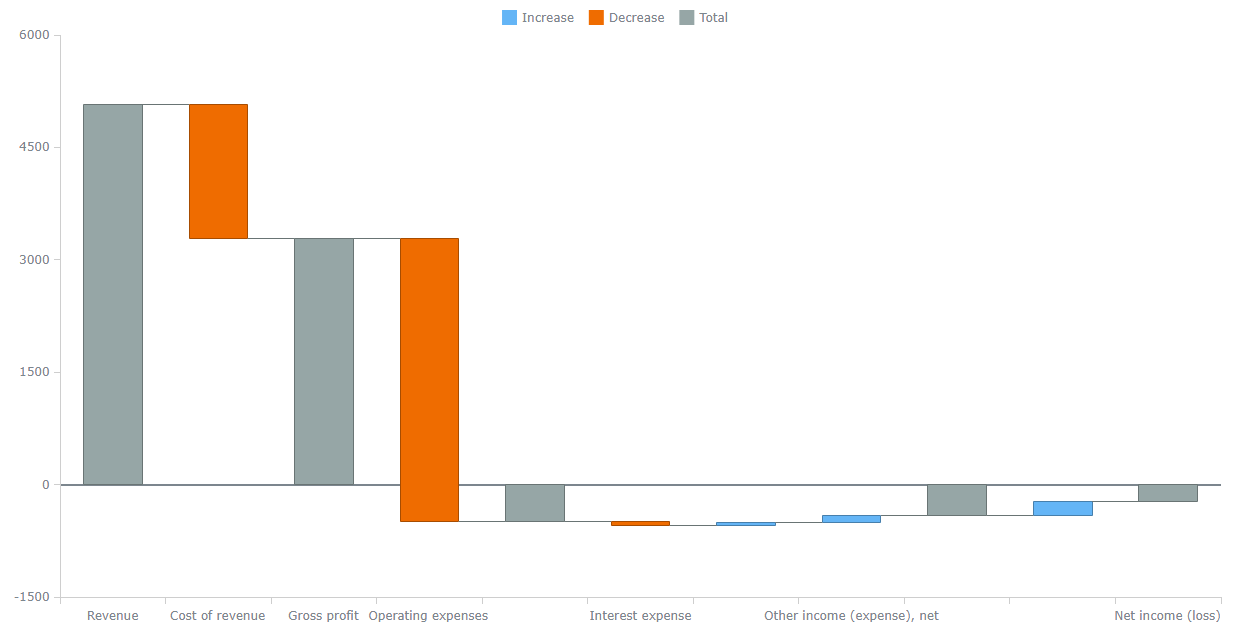
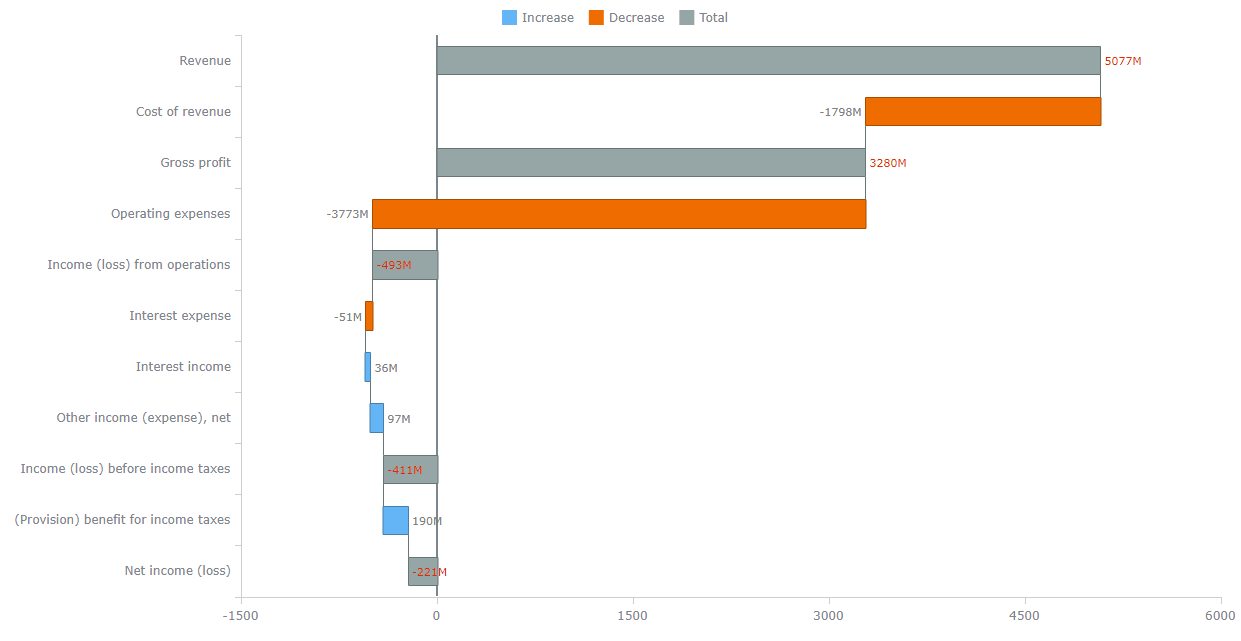
Initial Waterfall Chart Result
And there you have it! Your basic JavaScript waterfall chart comes to life. The complete code is provided below for your convenience. Feel free to explore the interactive version and play with the code on AnyChart Playground, and let’s proceed to customize this waterfall chart visualization in the next section of the tutorial!
<!DOCTYPE html>
<html lang="en">
  <head>
    <meta charset="utf-8">
    <title>JavaScript Waterfall Chart</title>
    <script src="https://cdn.anychart.com/releases/8.11.1/js/anychart-core.min.js"></script>
    <script src="https://cdn.anychart.com/releases/8.11.1/js/anychart-waterfall.min.js"></script>
    <style>
      html, body, #WaterfallContainer {
        width: 100%;
        height: 100%;
        margin: 0;
        padding: 0;
      }
    </style>
  </head>
  <body>
    <div id="WaterfallContainer"></div>
    <script>
      anychart.onDocumentReady(function () {
        // set the data
        var data = [
          { x: "Revenue", value: 5077.482 },
          { x: "Cost of revenue", value: -1797.510 },
          { x: "Gross profit", isTotal: true },
          { x: "Operating expenses", value: -3772.711 },
          { x: "Income (loss) from operations", isTotal: true },
          { x: "Interest expense", value: -51.186 },
          { x: "Interest income", value: 35.683 },
          { x: "Other income (expense), net", value: 97.129 },
          { x: "Income (loss) before income taxes", isTotal: true },
          { x: "(Provision) benefit for income taxes", value: 189.704 },
          { x: "Net income (loss)", isTotal: true }
];
        // create a waterfall chart
        var chart = anychart.waterfall();
        // create a series and set the data
        var series = chart.waterfall(data);
        // hide the labels
        series.labels(false);
        // set the container for the chart
        chart.container("WaterfallContainer");
        // draw the resulting chart
        chart.draw();
      });
    </script>
  </body>
</html>
B. Customizing JS Waterfall Chart
Now, let’s see how you can enhance the visual appeal of the waterfall chart by adding some customizations..
1. Add Zero Line Marker
When working with negative values, it can be advantageous to include a zero line marker on the X axis. This zero line acts as a reference point, visually separating positive and negative values. You can achieve this by adding the following code.
var line = chart.lineMarker().value(0);
2. Rotate Chart
In some cases where certain income statement items have lengthy names, you can improve the chart's appearance by rotating the X axis labels, or even the entire chart which is what you can see below. The following change in orientation to a vertical layout provides more space for accommodating extended item names.
chart.isVertical(true);
Additionally, you can arrange the bars in reverse order to enhance the legibility of the waterfall chart.
chart.xScale().inverted(true);

3. Configure Labels
Labels play a crucial role in conveying information to viewers. By customizing labels, you can significantly enhance the chart's visual presentation and readability.
To start, enable series labels by simply removing the series.labels(false); line. Labels are displayed by default unless specified otherwise.
Next, for instance, customize the appearance of labels within the chart using HTML as shown below. The formatting logic applied within the corresponding function allows you to apply different styles depending on whether the label represents a total value or a non-total value. Total values are displayed in red with a lighter font weight, while non-total values are shown in gray. Additionally, rounded values (with zero decimal places) are displayed in both cases.
chart.labels()
  .useHtml(true)
  .format(function() {
    if (this.isTotal)
      return "<span style='color: #dd2c00; font-weight: 100; font-size: 11'>" +
        this.absolute.toFixed(0) + "M" + "</span>";
      return "<span style='color: gray; font-weight: 100; font-size: 11'>" +
        this.diff.toFixed(0) + "M" + "</span>";
  });
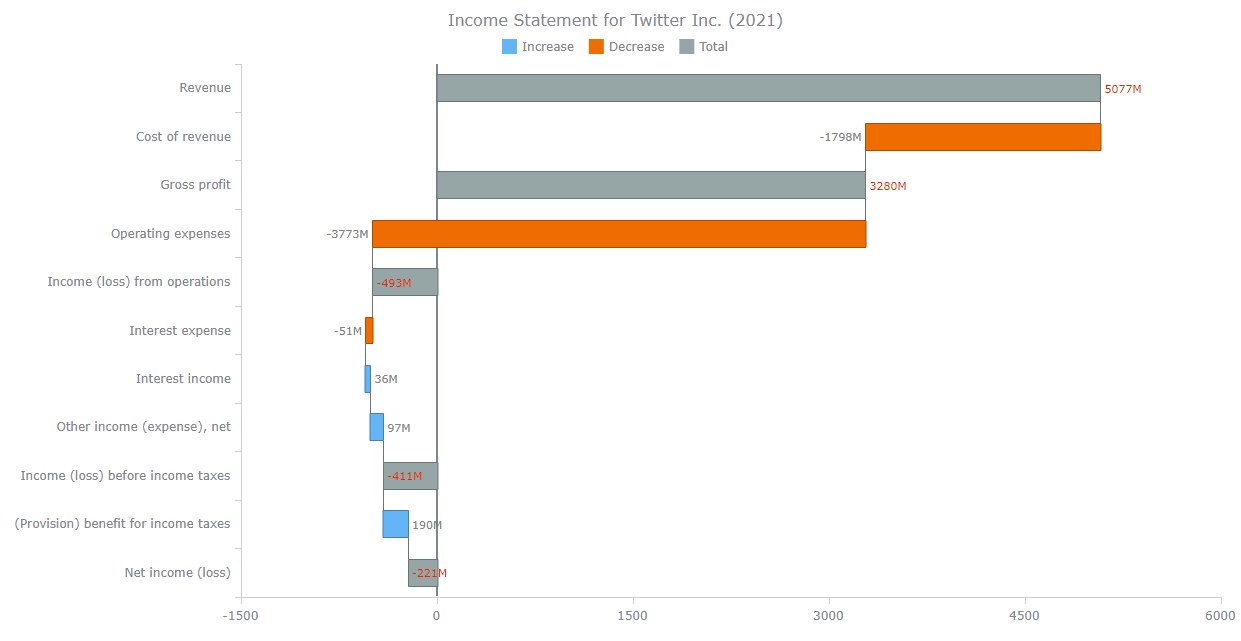
4. Name Chart
Providing a clear and informative title for your waterfall chart is essential to help users quickly understand what the graphic represents. Here’s how you can name the chart, making it obvious at a glance that it displays the income statement for Twitter Inc. for the year 2021.
chart.title("Income Statement for Twitter Inc. (2021)");
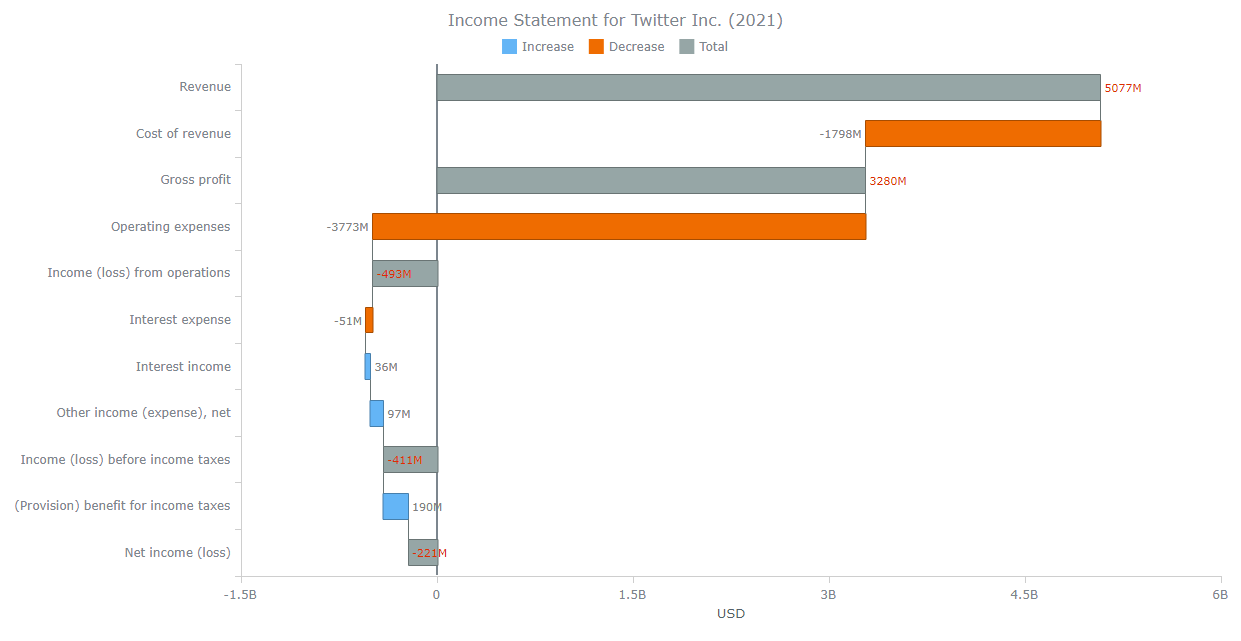
5. Customize Value Axis
You can also improve the clarity of the chart by changing the format of the values represented on the value (Y) axis. Specifically, you can name the axis "USD" to denote the currency. Additionally, you can format the values to be more understandable, such as by showing values in billions of USD for larger values, like in this case.
// customize the format of the y-axis labels
chart.yAxis().labels().format("{%Value}{scale:(1000)(1)|(B)}");

// set the y-axis title
chart.yAxis().title("USD");
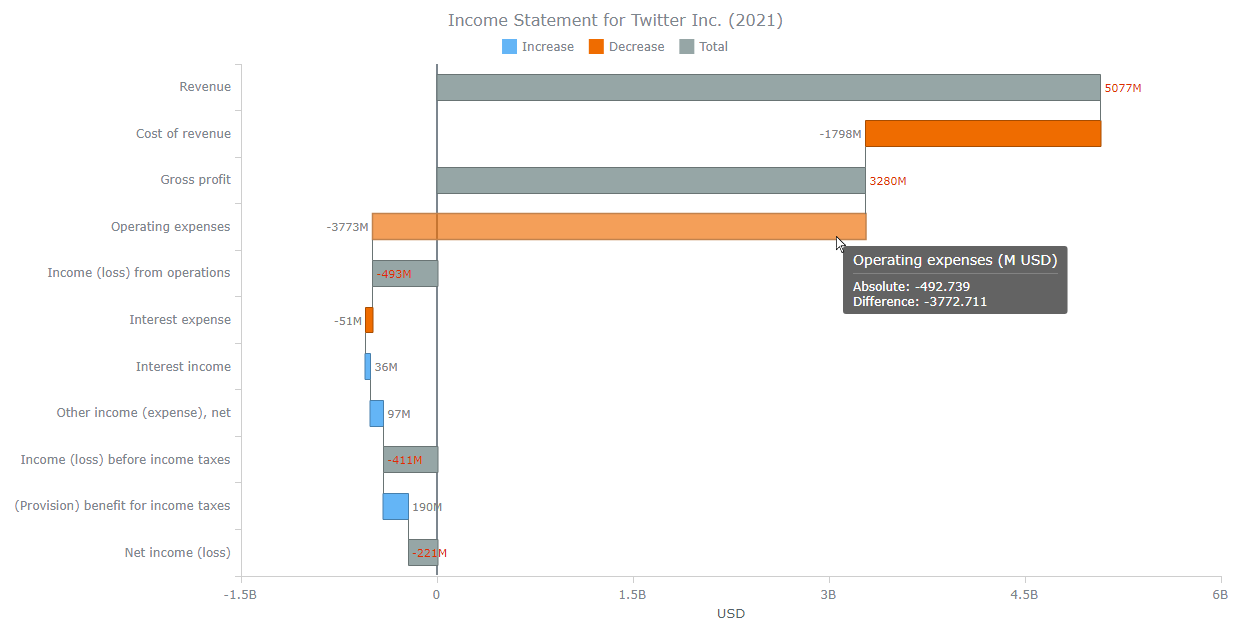
6. Configure Tooltip
Tooltips provide valuable information to users when interacting with the chart. To make tooltips more direct and precise, you can customize them as you need. In this case, for example, the "M USD" in the tooltip title makes it obvious that values within the tooltip are displayed in millions of USD.
chart.tooltip().titleFormat("{%x}" + " (M USD)");
7. Configure Visual Appearance
You can also improve the visual appearance by customizing the coloring. For instance, the code below enriches the connectors’ stroke with a vibrant red color and a dashed pattern, making it visually striking.
chart.connectorStroke("#ff6666", 2, "2 2", "round");
Furthermore, you can configure the appearance of the bars in different states, including normal, hovered, and selected. Here’s how you can specify distinct visual settings for falling and rising values, tailoring the chart's visual presentation according to your preferences and specific design requirements.
// normal state
series.normal()
  .fill("#8C8C8C", 0.7)
  .hatchFill("forward-diagonal", "#BEBEBE", 1, 10)
  .stroke("#8C8C8C")
  .fallingFill("#FC4E6F", 0.8)
  .fallingStroke("#FC4E6F", 1, )
  .risingFill("#44C882", 0.8)
  .risingStroke("44C882");
// hovered state
series.hovered()
  .fill("#8C8C8C", 0.1)
  .hatchFill("forward-diagonal", "#117A65", 1, 10)
  .stroke("#8C8C8C", 2)
  .fallingFill("#FC4E6F", 0.1)
  .fallingStroke("#FC4E6F", 2, "10 5", )
  .risingFill("44C882", 0.1)
  .risingStroke("44C882", 2);
// selected state
series.selected()
  .fill("#8C8C8C", 0.5)
  .hatchFill("forward-diagonal", "#8C8C8C", 1, 10)
  .stroke("#8C8C8C", 4)
  .fallingFill("#922B21", 0.5)
  .fallingStroke("#B03A2E", 4, )
  .risingFill("#117864", 0.5)
  .risingStroke("#148F77", 1);
8. Add Arrow to Visualize Total Change
In the final step of this waterfall chart tutorial, I’ll show you how to add an arrow to connect the initial and final values, providing a clear visual representation of the total change. Check it out.
// add an arrow
var totalChangeArrow = chart.addArrow({
  from: "Revenue",
  to: "Net income (loss)"
});

// set arrow's label format
totalChangeArrow.label().format("{%Value}{numDecimals:0}" + "M");
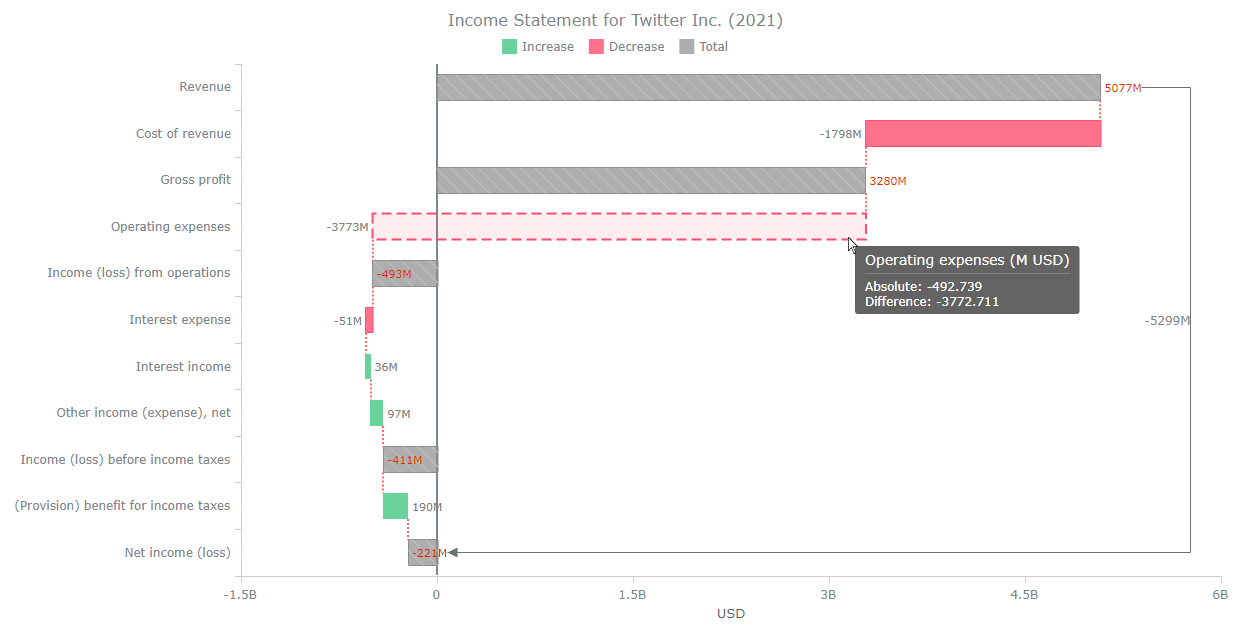
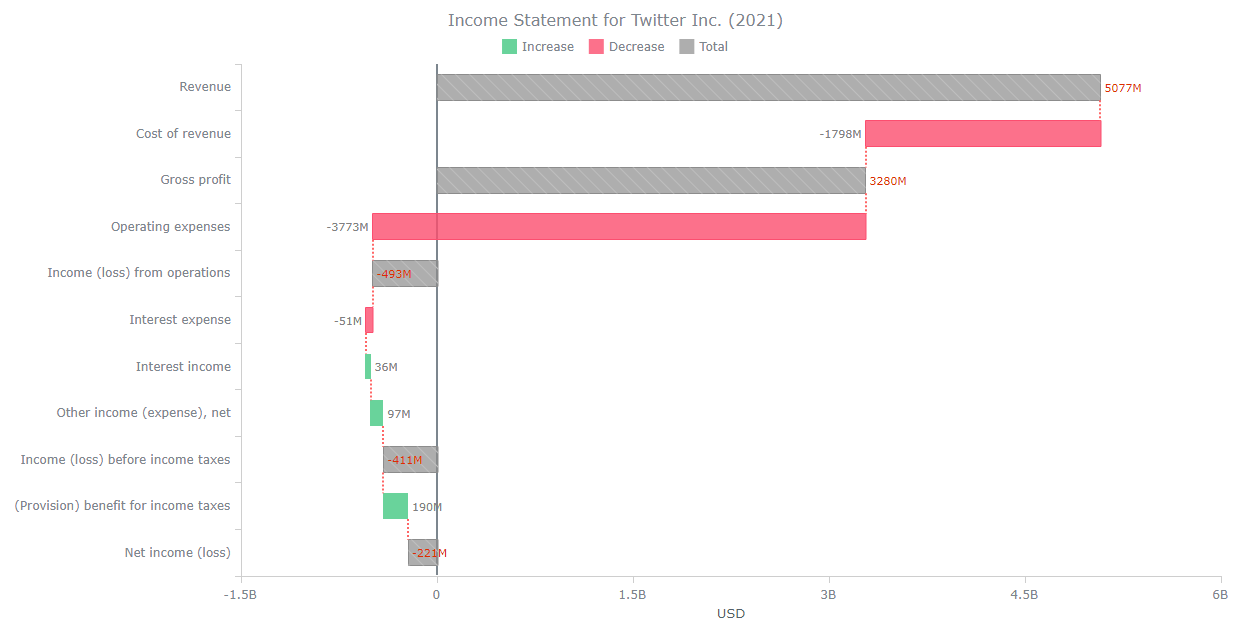
Final Result
After implementing these customizations one by one, I am excited to present the final version of the waterfall chart powered by JavaScript. Its sleek design and smooth interactivity make it an exceptional tool for data visualization.
Feel free to access and modify the source code on AnyChart Playground to suit your specific needs. Experiment with colors, interactions, and other features to create a chart that perfectly matches your unique style. For your convenience, I have included the entire code of this JS waterfall chart below.
<!DOCTYPE html>
<html lang="en">
  <head>
    <meta charset="utf-8">
    <title>JavaScript Waterfall Chart</title>
    <script src="https://cdn.anychart.com/releases/8.11.1/js/anychart-core.min.js"></script>
    <script src="https://cdn.anychart.com/releases/8.11.1/js/anychart-waterfall.min.js"></script>
    <style>
      html, body, #WaterfallContainer {
        width: 100%;
        height: 100%;
        margin: 0;
        padding: 0;
      }
    </style>
  </head>
  <body>
    <div id="WaterfallContainer"></div>
    <script>
      anychart.onDocumentReady(function () {
        // set the data
        var data = [
          { x: "Revenue", value: 5077.482 },
          { x: "Cost of revenue", value: -1797.510 },
          { x: "Gross profit", isTotal: true },
          { x: "Operating expenses", value: -3772.711 },
          { x: "Income (loss) from operations", isTotal: true },
          { x: "Interest expense", value: -51.186 },
          { x: "Interest income", value: 35.683 },
          { x: "Other income (expense), net", value: 97.129 },
          { x: "Income (loss) before income taxes", isTotal: true },
          { x: "(Provision) benefit for income taxes", value: 189.704 },
          { x: "Net income (loss)", isTotal: true }
        ];
        // create a waterfall chart
        var chart = anychart.waterfall();
        // add the zero line
        var line = chart.lineMarker().value(0);
        // rotate the chart
        chart.isVertical(true);
        // set the reverse order of the bars
        chart.xScale().inverted(true);
        // customize the labels
        chart.labels()
          .useHtml(true)
          .format(function() {
            if (this.isTotal)
              return "<span style='color: #dd2c00; font-weight: 100; font-size: 11'>" +
                this.absolute.toFixed(0) + "M" + "</span>";
              return "<span style='color: gray; font-weight: 100; font-size: 11'>" +
                this.diff.toFixed(0) + "M" + "</span>";
          });
        // set the chart title
        chart.title("Income Statement for Twitter Inc. (2021)");
        // add the usd caption on the y-axis labels
        chart.yAxis().labels().format("{%Value}{scale:(1000)(1)|(B)}");
        // set the y-axis title
        chart.yAxis().title("USD");
        // create a series and set the data
        var series = chart.waterfall(data);
        // configure the tooltip title
        chart.tooltip().titleFormat("{%x}" + " (M USD)");
        // customize the connector stroke
        chart.connectorStroke("#ff6666", 2, "2 2", "round");
        // configure the visual settings of the series:
        // normal state
        series.normal()
          .fill("#8C8C8C", 0.7)
          .hatchFill("forward-diagonal", "#BEBEBE", 1, 10)
          .stroke("#8C8C8C")
          .fallingFill("#FC4E6F", 0.8)
          .fallingStroke("#FC4E6F", 1, )
          .risingFill("#44C882", 0.8)
          .risingStroke("44C882");
        // hovered state
        series.hovered()
          .fill("#8C8C8C", 0.1)
          .hatchFill("forward-diagonal", "#117A65", 1, 10)
          .stroke("#8C8C8C", 2)
          .fallingFill("#FC4E6F", 0.1)
          .fallingStroke("#FC4E6F", 2, "10 5", )
          .risingFill("44C882", 0.1)
          .risingStroke("44C882", 2);
        // selected state
        series.selected()
          .fill("#8C8C8C", 0.5)
          .hatchFill("forward-diagonal", "#8C8C8C", 1, 10)
          .stroke("#8C8C8C", 4)
          .fallingFill("#922B21", 0.5)
          .fallingStroke("#B03A2E", 4, )
          .risingFill("#117864", 0.5)
          .risingStroke("#148F77", 1);
        // add an arrow
        var totalChangeArrow = chart.addArrow({
          from: "Revenue",
          to: "Net income (loss)"
        });
        // set arrow's label format
        totalChangeArrow.label().format("{%Value}{numDecimals:0}" + "M");
        // set the container id for the waterfall chart
        chart.container("WaterfallContainer");
        // draw the resulting chart
        chart.draw();
      });
    </script>
  </body>
</html>
Conclusion
This tutorial was designed to be a comprehensive and user-friendly guide to ensure you can effortlessly create waterfall charts using JavaScript (HTML5). I hope we've succeeded in that endeavor.
If you have any questions or require further assistance, please don't hesitate to ask in the comments section. I'm here to help and will do my best to address any doubts you may have. I'm eagerly looking forward to the fantastic waterfall charts you'll create using this guide, so feel free to share your creative visualizations. For inspiration, you can take a look at this waterfall chart gallery and learn more in the waterfall chart documentation. And your contributions can be a source of further inspiration for others, including myself.
Happy charting!
Published with the permission of Awan Shrestha. Originally appeared on DEV Community under the title “How to Build a Waterfall Chart with JavaScript” on November 1, 2023.
You might also be interested in reading the JavaScript Waterfall Chart Tutorial specifically produced by Dilhani Withanage for our blog earlier, visualizing the 2020 income statement for Alphabet Inc. (GOOGL) step by step.
Delve into other JavaScript charting tutorials and continue honing your skills in interactive data visualization.
If you’re interested in contributing a guest post to our blog, please don’t hesitate to contact us.
- Categories: AnyChart Charting Component, Big Data, Business Intelligence, HTML5, JavaScript, JavaScript Chart Tutorials, Tips and Tricks
- No Comments »