 Get ready for another dose of cool visual data graphics — DataViz Weekly is here! Today we are glad to acquaint you with the following new interesting projects:
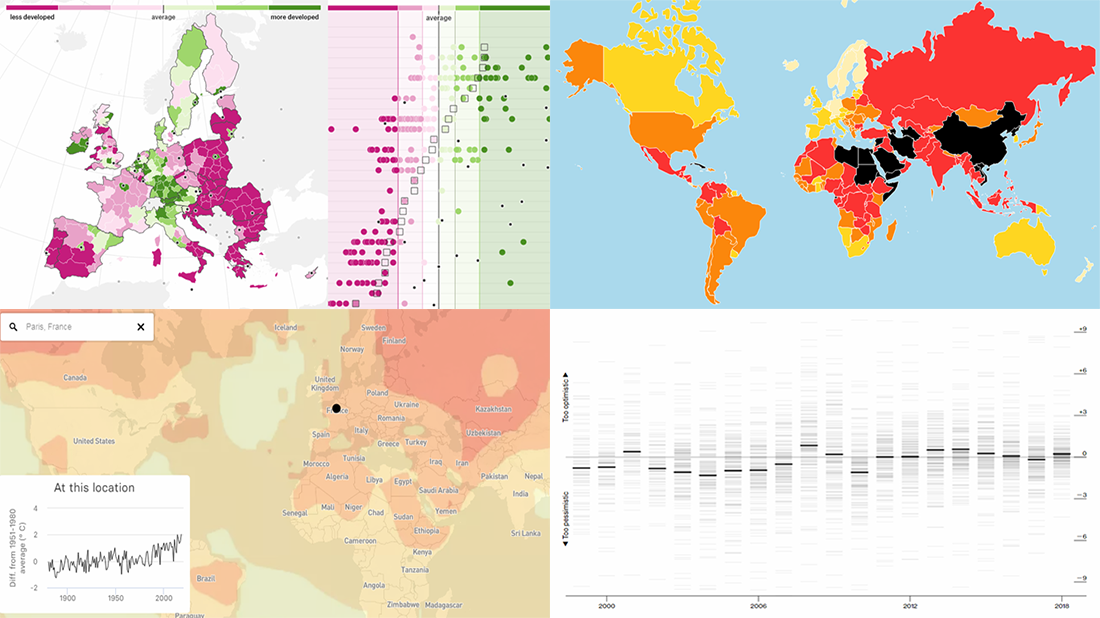
- The Pudding explains why EU regions redraw their borders.
- Reporters Without Borders shares its annual World Press Freedom Index for 2019.
- Bloomberg analyzes errors in the International Monetary Fund’s spring forecasts of same-year GDP growth.
- BuzzFeed visualizes how climate change has already transformed the planet.
New Interesting Visual Data Graphics in Data Visualization Weekly: April 19, 2019 — April 26, 2019
Explaining Why EU Regions Get New Borders
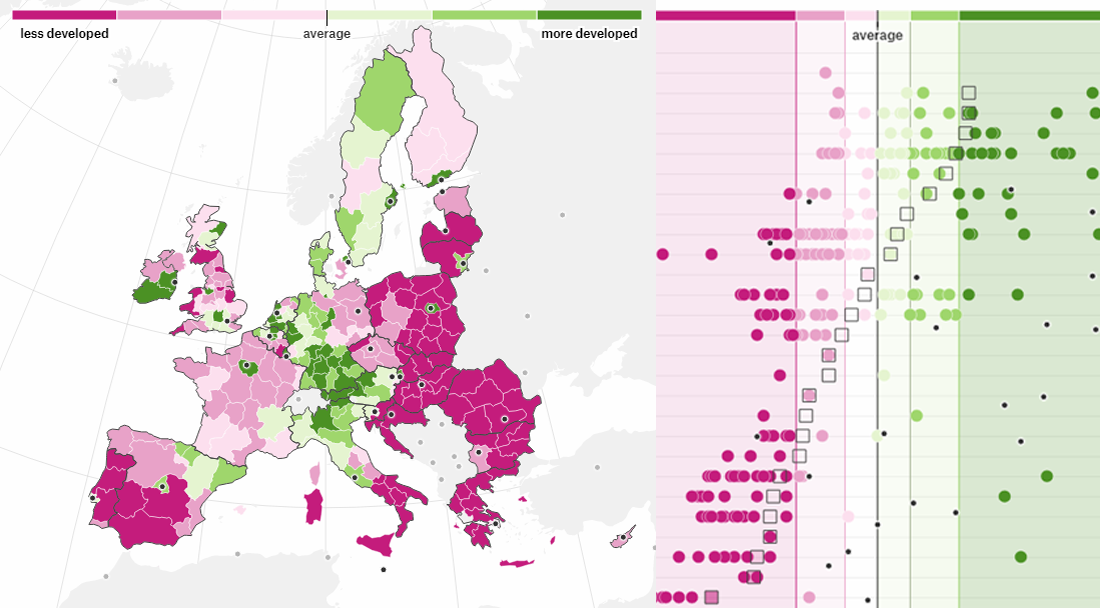
The European Union spends about one-third of its budget on funding infrastructure projects in less economically developed regions, supporting transport, education, health care, and so on. But as regions improve their GDP figures, which is the explicit purpose, they approach the brink of getting less EU investments. This is exactly why governors of some regions decide to change their borders by splitting the territory into two parts, one more developed, and one with a lower GDP that again can qualify for EU catch-up funds in full, keeping the money flowing. Interested? The Pudding uses cool data visuals to explain how the border redrawing scheme works and how Hungary, Poland, and Lithuania have already pulled it off.
Analyzing Freedom of Press Worldwide in 2019
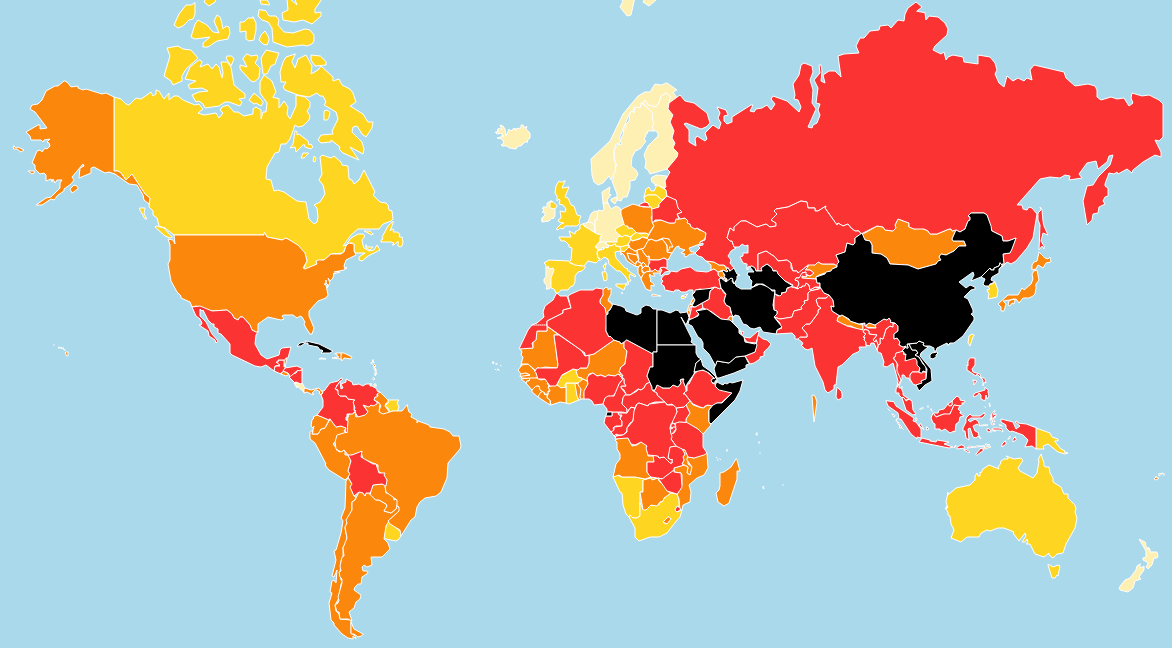
Reporters Without Borders (RSF) published its annual World Press Freedom Index for 2019. Based on evaluations of the journalists’ independence and safety, as well as pluralism and legislation quality, it ranks 180 countries and regions according to the degree of freedom available to media on their territory. Check out RSF’s interactive map for a visual overview of the new World Press Freedom Index data, and see the ranking table for more information.
Charting Errors in IMF’s Spring Forecasts of Same-Year GDP Growth
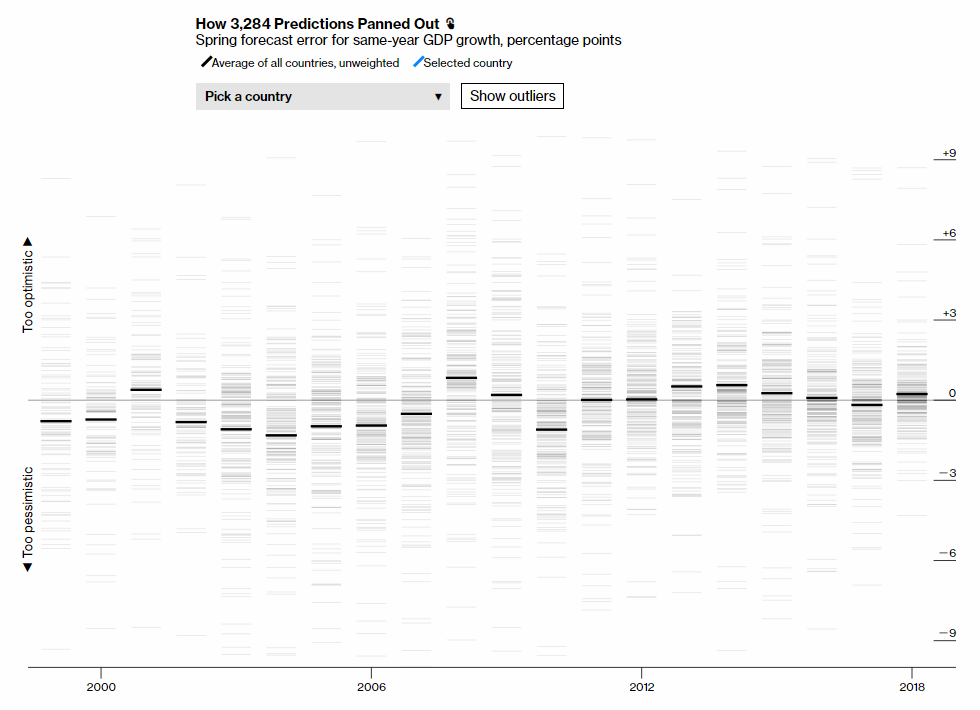
Inspired by the release of the new World Economic Outlook report from the International Monetary Fund, Bloomberg decided to find out how good the IMF’s predictions have actually been so far and studied 3,284 same-year country forecasts published each spring since 1999. As discovered by the analysts, there used to be a really wide variation in the magnitude and direction of forecast errors. To understand how much trust should be put in IMF’s spring forecasts of same-year GDP growth around the world according to the experts’ findings, take a closer look using Bloomberg’s special interactive charts as well as explore the accompanying map to reveal the level of misses by region and another chart providing focus on the changing outlook for Greece, Ireland, Portugal, and Cyprus as bailout countries.
Visualizing How Climate Change Already Transformed Earth
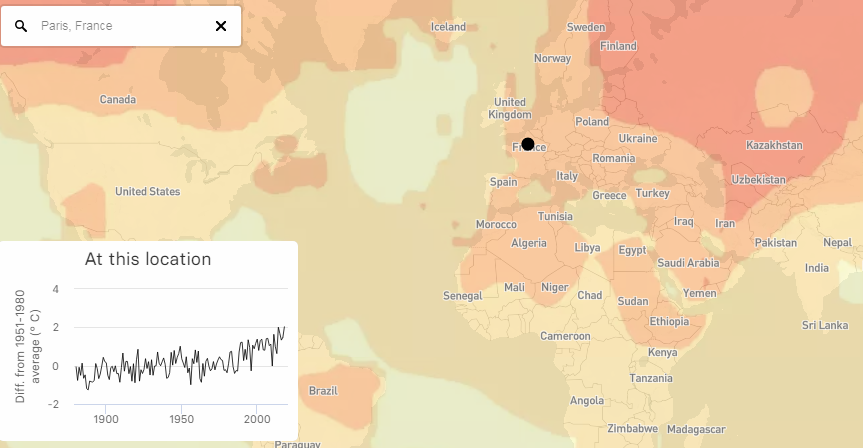
This week, BuzzFeed has published a series of articles on the topic of climate change. While all of the stories are really worth-reading, we are glad to feature one with interesting visual data graphics. Peter Aldhous mapped how the average annual temperature has changed all over the world. When you click on any place on the map, you’ll also see a line chart that shows the temperature change data over time for that specific location. So you can quickly explore how climate change has already changed your city. Also, don’t miss out on the two data visualizations further down the article. The first one shows how the sea ice area has shrunk. The other displays how the sea level has changed.
***
Thanks for staying with us! Have a great weekend time, everyone! See you again soon on our blog!
- Categories: Data Visualization Weekly
- No Comments »