New Helpful Features in AnyGantt Project Management Bundle for Qlik Sense
June 16th, 2020 by AnyChart Team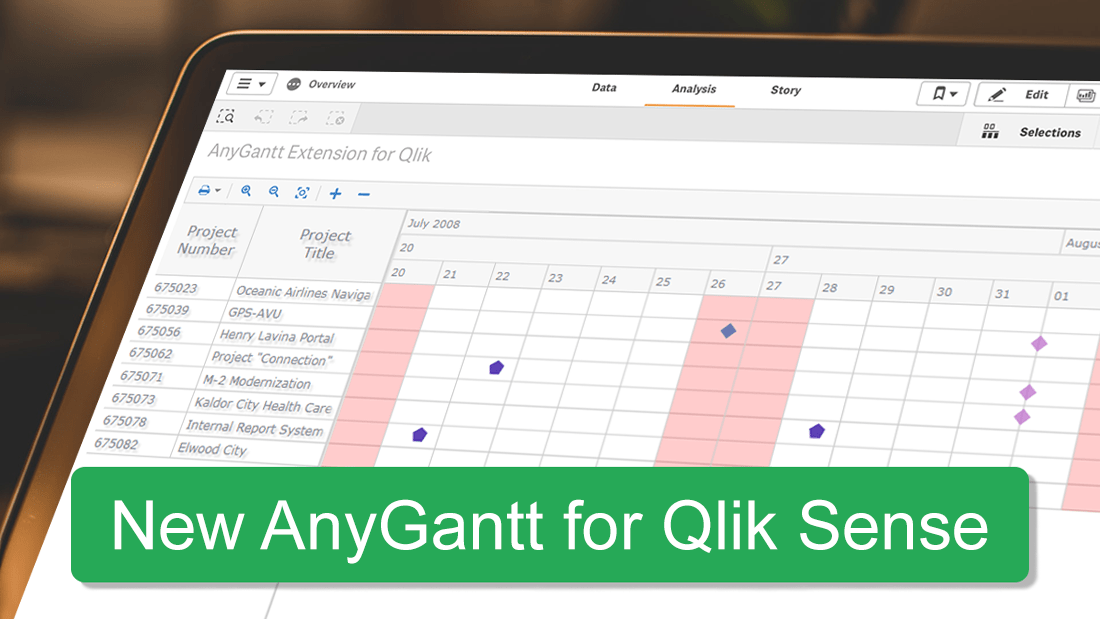 Just added, two new helpful features for our project management bundle for Qlik Sense! Enjoy a more precise control over the visualization of your data and make better decisions!
Read more at qlik.anychart.com »
- Categories: AnyChart Charting Component, AnyGantt, Big Data, Business Intelligence, Gantt Chart, News, Qlik
- No Comments »
JavaScript Charting Library 8.8.0 Released with New Exciting Data Viz Features
May 22nd, 2020 by AnyChart Team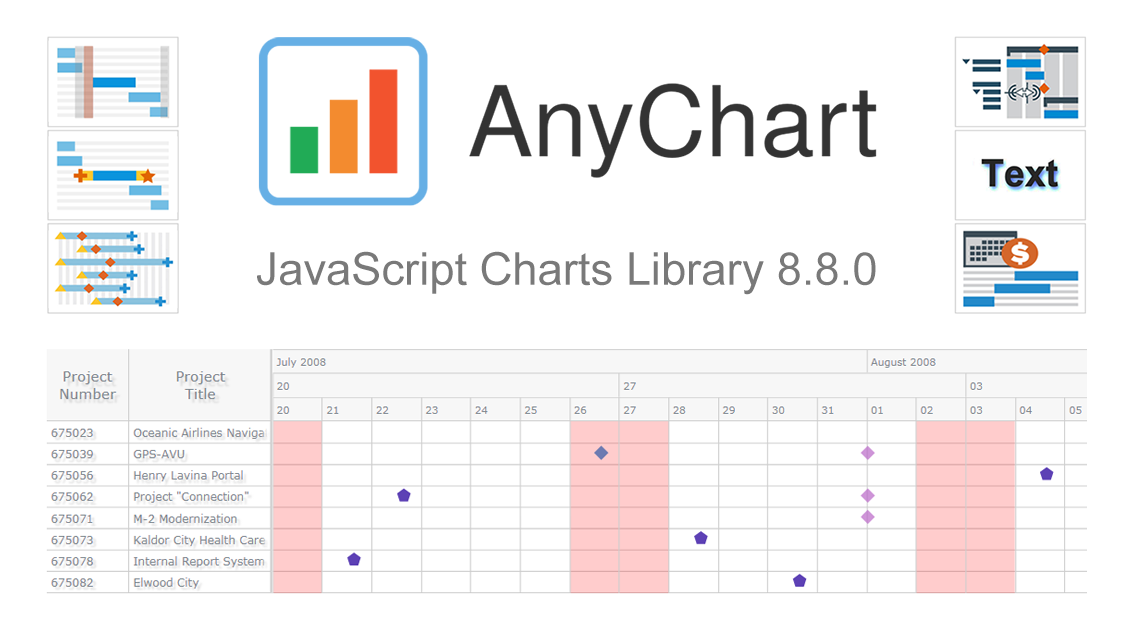 We’ve just updated our JavaScript charting library with new exciting features and improvements! In the 8.8.0 release of AnyChart JS, the focus is put on enhancements for Gantt charts. They will be helpful in making your project and resource data visualizations even more insightful with ease. We’ve also upgraded basic and time-series charts as well as maps. Below is an overview of the new key arrivals. Be sure to check it out, download the updated builds, and enjoy!
»»» See What’s New in AnyChart 8.8.0! «««
- Categories: AnyChart Charting Component, AnyGantt, AnyMap, AnyStock, Big Data, Business Intelligence, Dashboards, Financial Charts, Gantt Chart, HTML5, JavaScript, News, Stock Charts
- 1 Comment »
Qlik Sense Timeline Chart and More New Features in AnyGantt Extension V 4.1.244
April 24th, 2020 by AnyChart Team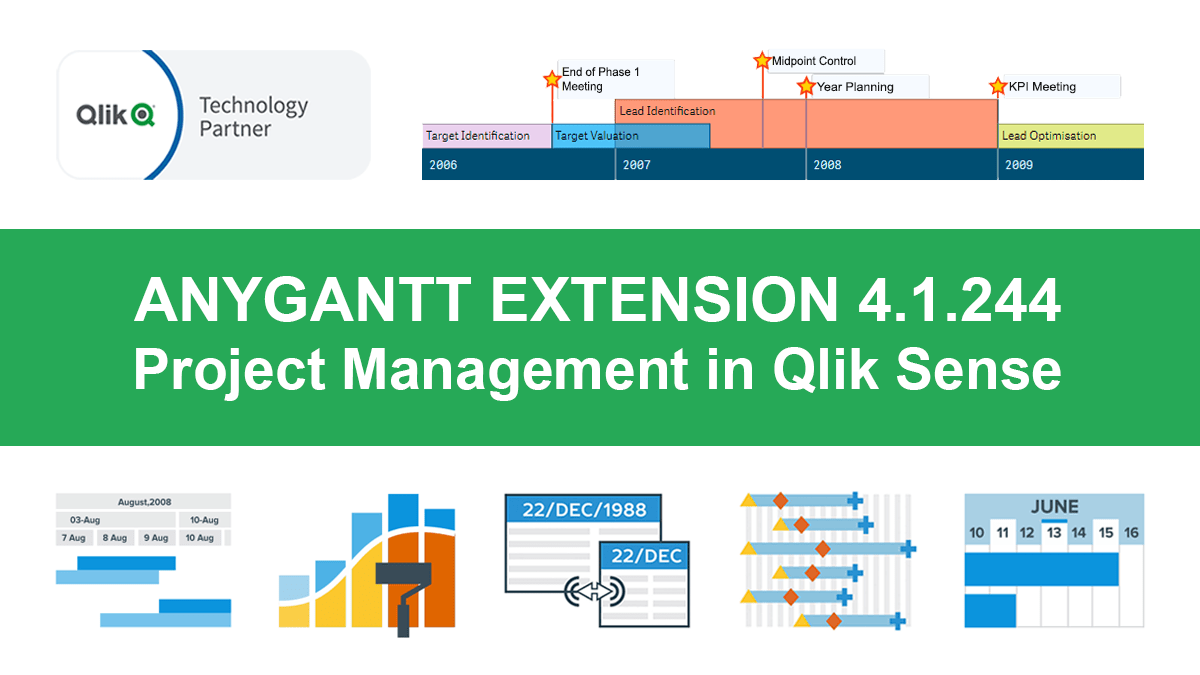 Hey Qlikkies, meet the awesome Qlik Sense Timeline Chart from AnyChart! We are excited to deliver it in the new, just-released version of our AnyGantt extension.
Hence the Timeline Chart has become — wait for it — the 40th chart type available in our data visualization extensions for Qlik Sense overall! For AnyGantt specifically it is the 3rd one, making AnyGantt a unique, cutting-edge Project Management Bundle for Qlik now comprising the Project Gantt Chart, Resource Chart, and Timeline Chart in a single intuitive extension.
However, it is not all great news. Release 4.1.244 also brings a bunch of other awesome features and improvements to the AnyGantt extension.
Read more at qlik.anychart.com »
- Categories: AnyChart Charting Component, AnyGantt, Big Data, Business Intelligence, Gantt Chart, News, Qlik
- No Comments »
AnyGantt Extension NOW Available in Qlik Sense Cloud Edition! [+ How-to-Install Video]
March 12th, 2020 by AnyChart Team Great news for Qlik users! AnyGantt Extension for Qlik Sense is now available in the cloud!
As of February 2020, customers using Qlik Sense in the cloud can benefit from 3rd party extensions such as those by AnyChart, a trusted Qlik Technology Partner.
Read more at qlik.anychart.com »
- Categories: AnyChart Charting Component, AnyGantt, Big Data, Business Intelligence, Dashboards, Gantt Chart, News, Qlik
- No Comments »
AnyChart JS Charts 8.7.1 Is Ready for Download — Enjoy New Version!
January 28th, 2020 by AnyChart Team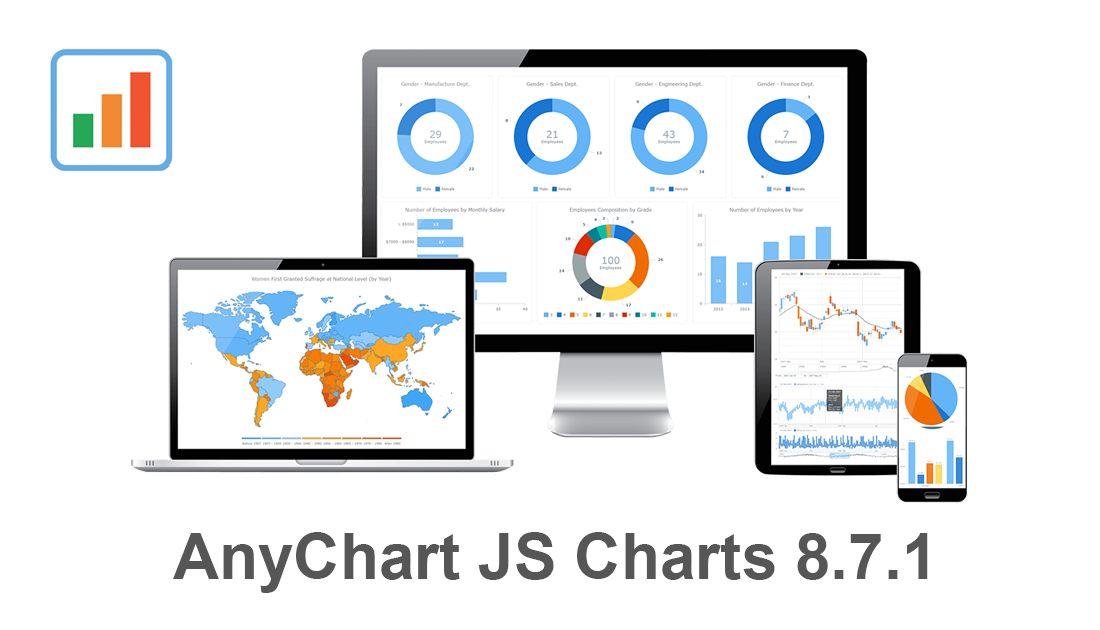 Our JavaScript charting libraries are now updated! Just before the new year, we delivered important fixes and improvements to them in version 8.7.1. These updates make it even better to visualize data using our flexible visualization solutions for cross-platform HTML5 charting — AnyChart JS for basic charts, AnyGantt JS for project and resource charts, AnyStock JS for stock and any other time-series charts, and AnyMap JS for geographical and seat map charts.
Download version 8.7.1 now and start enjoying our updated JavaScript charting libraries!
Check the version history of the library you are using to see exactly what has been improved and fixed in the new release:
Let us know what else we should add or enhance. We’ve been always listening to you and your feedback has always largely determined our roadmap. Of course, this will remain so in the new year (and beyond). Any questions, give us a shout and we’ll be happy to assist you asap.
We wish you a happy and prosperous 2020!
- Categories: AnyChart Charting Component, AnyGantt, AnyMap, AnyStock, Big Data, Business Intelligence, Dashboards, Financial Charts, Gantt Chart, HTML5, JavaScript, News, Stock Charts
- No Comments »
Try Updated AnyGantt Extension for Qlik Sense with New Stunning Features
January 22nd, 2020 by AnyChart Team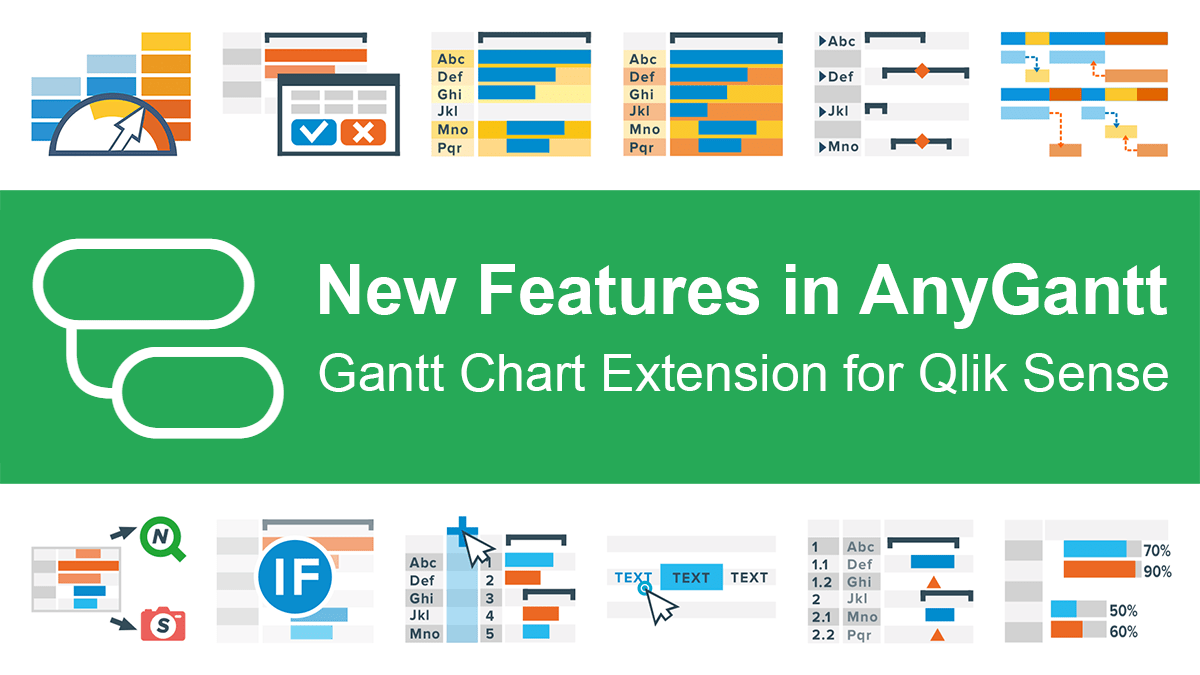 Great news for Qlikkies: We released another major update to our AnyGantt extension for Qlik Sense, which will further enhance your project data visualization experience. So the current 4th generation of our solution for Gantt charts in Qlik already delivers a whole bunch of new awesome features and improvements — learn about them now in a quick overview.
Read more at qlik.anychart.com »
- Categories: AnyChart Charting Component, AnyGantt, Big Data, Business Intelligence, Gantt Chart, News, Qlik
- No Comments »
AnyChart Recognized in Top 10 Business Intelligence and Analytics Companies of 2019
November 19th, 2019 by AnyChart Team We are excited to announce that Analytics Insight, a magazine that covers big data and business intelligence developments, included AnyChart in The 10 Next Generation BI and Analytics Companies of 2019 — “for providing the most advanced solutions and playing a significant role in shaping the future of these disruptive technologies.”
The list has been made public in the just-released November issue of the magazine and is accompanied by the stories about each featured company. With permission of Analytics Insight, today we are republishing the magazine’s story about us on our blog — “AnyChart: Turning Data into Actionable Insights with Award-Winning Data Visualization Solutions.”
Read the story of AnyChart as it appeared on Analytics Insight »
- Categories: AnyChart Charting Component, AnyGantt, AnyMap, AnyStock, Big Data, Business Intelligence, Charts and Art, Dashboards, Financial Charts, Flash Platform, Gantt Chart, GraphicsJS, HTML5, Interesting Facts, JavaScript, News, Success Stories
- No Comments »
Qlik Sense Gantt Chart Extension AnyGantt Gets New Awesome Features in Version 4.0
November 1st, 2019 by AnyChart Team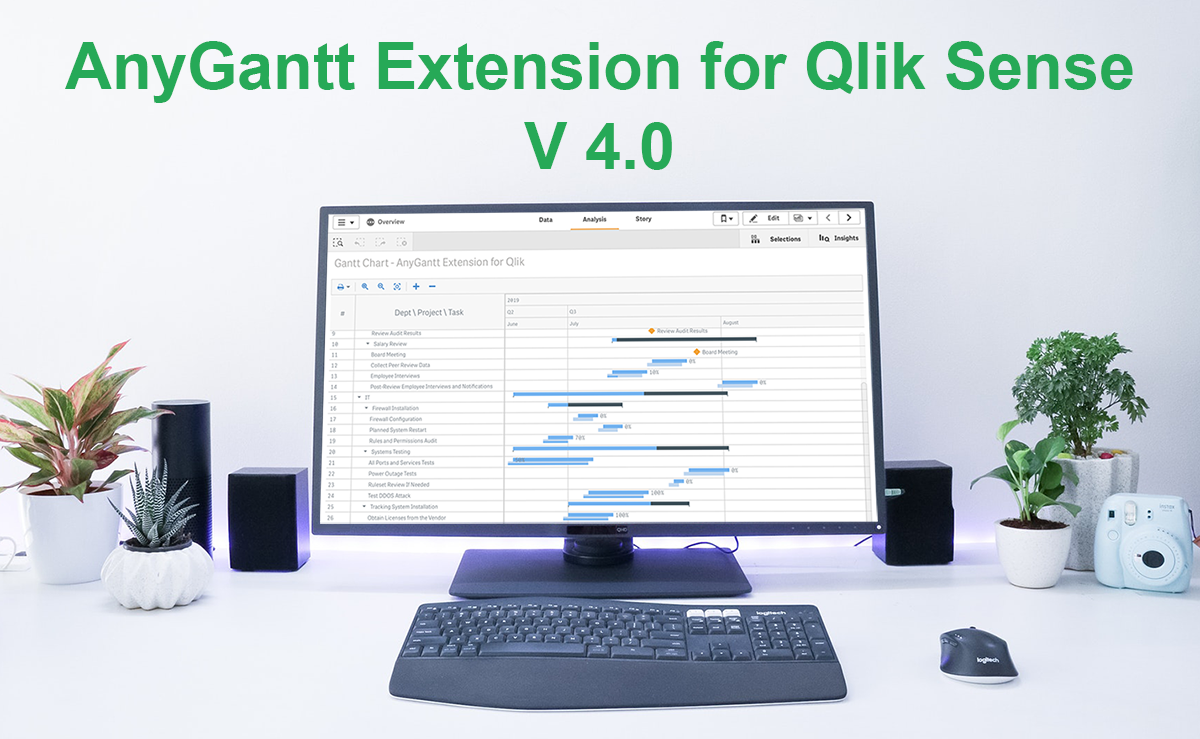 Good news, Qlikkies! We’ve released a major update to our Qlik Sense Gantt chart extension AnyGantt, bringing a bunch of new awesome features to further improve your project and resource data visualization experience using it. Look what’s new in version 4.0!
Read more at qlik.anychart.com »
- Categories: AnyChart Charting Component, AnyGantt, News, Qlik
- No Comments »
AnyChart CEO Anton Baranchuk Named One of Most Promising CEOs of 2019
August 13th, 2019 by AnyChart Team Insights Success magazine has named Anton Baranchuk, CEO and Co-founder of AnyChart, one of The Most Promising CEOs of 2019. Celebrating this exciting recognition, we are pleased to share with you a special article about him and our company. Published in the latest issue of Insights Success, the story is based on Anton’s recent interview with the magazine. Take a read.
- Categories: AnyChart Charting Component, News, Success Stories
- No Comments »
JavaScript Graph Visualization Libraries Updated — Check Out AnyChart 8.7.0 with New Awesome Features!
August 8th, 2019 by AnyChart Team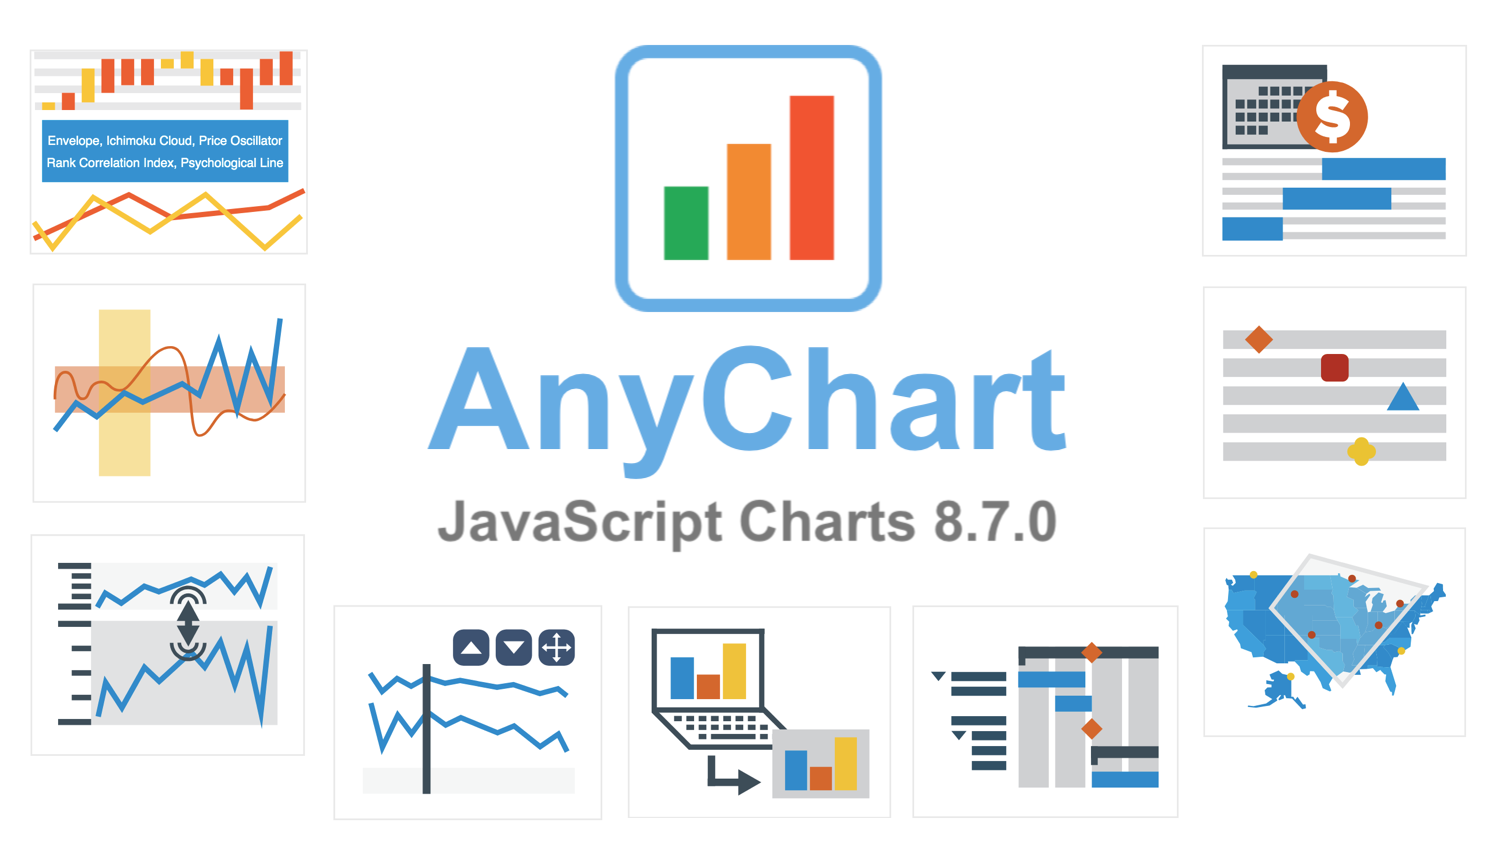 AnyChart 8.7.0 is out with a lot of new awesome data visualization features. Look what we’ve added to our JavaScript graph libraries in this major update.
»»» See What’s New in AnyChart 8.7.0! «««
- Categories: AnyChart Charting Component, AnyGantt, AnyMap, AnyStock, Big Data, Business Intelligence, Financial Charts, Gantt Chart, HTML5, JavaScript, News, Stock Charts
- 4 Comments »