 On this wonderful day, we are excited to announce a new major update for our JavaScript data visualization libraries: AnyChart 8.5.0 is released!
The new version brings a lot of advanced features and improvements that make our JS (HTML5) charting solutions even more powerful. 3D Surface Plot, Word Tree, and much more — spare a minute to look through the highlights of the 8.5.0 release of AnyChart, AnyStock, AnyGantt, and AnyMap.
New Features in AnyChart JS Charts 8.5.0
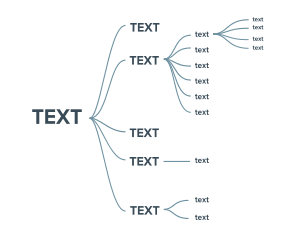 |
Word TreeUse the Word Tree chart type to visualize a set of words in a hierarchical way. Word Trees display which words most frequently follow or precede a certain target word or to show a hierarchy of terms. The font size of the words represents their weight — the frequency / number of children. Look at the Word Tree examples in our gallery and check out the Word Tree documentation. |
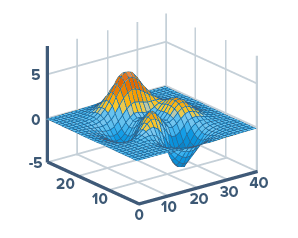 |
Surface ChartPick the Surface Chart (3D Surface Plot) type to visualize three-dimensional data as a mesh surface. Surface Charts can be helpful when you need to reveal the optimum combinations between two data sets. Colors and patterns in this chart type indicate which areas are in the same range of values. Look at the Surface Chart examples in our gallery and check out the Surface Chart documentation. |
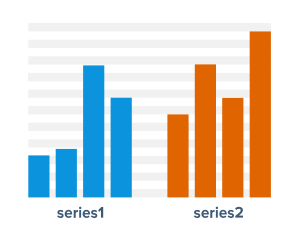 |
Multi-Series Charts Grouped by SeriesGet data points in a multi-series chart grouped by series when you want to visualize comparison in a different way. Now you can enable this mode for all basic Cartesian charts. Look at the Multi-Series Column Chart Categorized by Series example in our gallery. |
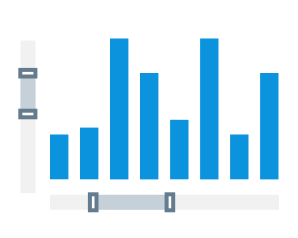 |
Y ScrollerEnable scrollers when one screen is not enough to properly visualize data — in release 8.5.0, we’ve delivered Y Scroller in addition to X Scroller. Look at the Chart with Y Scroller example in our gallery. |
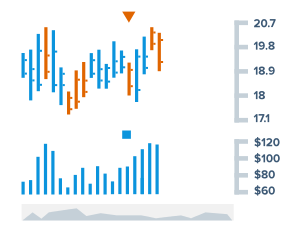 |
Stock Chart Timescale Minimum and Maximum GapsAdd gaps to the beginning and to the end of the stock chart timescale whenever you need empty space over there. Just specify how many intervals of what type to include where. Look at the Annotated Candlestick Chart with Minimum/Maximum Gaps example in our gallery. |
More Improvements for JavaScript Data Visualization Libraries
Release 8.5.0 of JavaScript data visualization libraries AnyChart, AnyStock, AnyGantt, and AnyMap has also delivered multiple important improvements and bug fixes.
In particular, we’ve added new chart constructors, ordinal scale modes, stock chart tooltip’s single display mode, and more.
Check out the version histories of our products for more information:
- AnyChart version history;
- AnyStock version history;
- AnyGantt version history;
- AnyMap version history.
Next Stop: AnyChart 8.5.1
Expect the next version of our JavaScript data visualization libraries AnyChart, AnyStock, AnyMap, and AnyGantt to go live in January 2019. It will be minor release 8.5.1, bringing new improvements and fixes.
Stay tuned for our plans — follow the public roadmaps of our products:
Please also feel free to send us new feature requests along with any other suggestions — just get in touch with our Support Team, and we’d love to hear and consider your ideas.
***
Enjoy AnyChart 8.5.0! And of course… Merry Christmas and happy holidays!
- Categories: AnyChart Charting Component, AnyGantt, AnyMap, AnyStock, HTML5, JavaScript, News
- 1 Comment »