 Less than four months have passed since we presented version 2.0 of our Qlik Sense extension for advanced data visualization. During that short time period, we released three more updates: 2.0.1, 2.1.0 and 2.2.0. And here’s a new one ready!
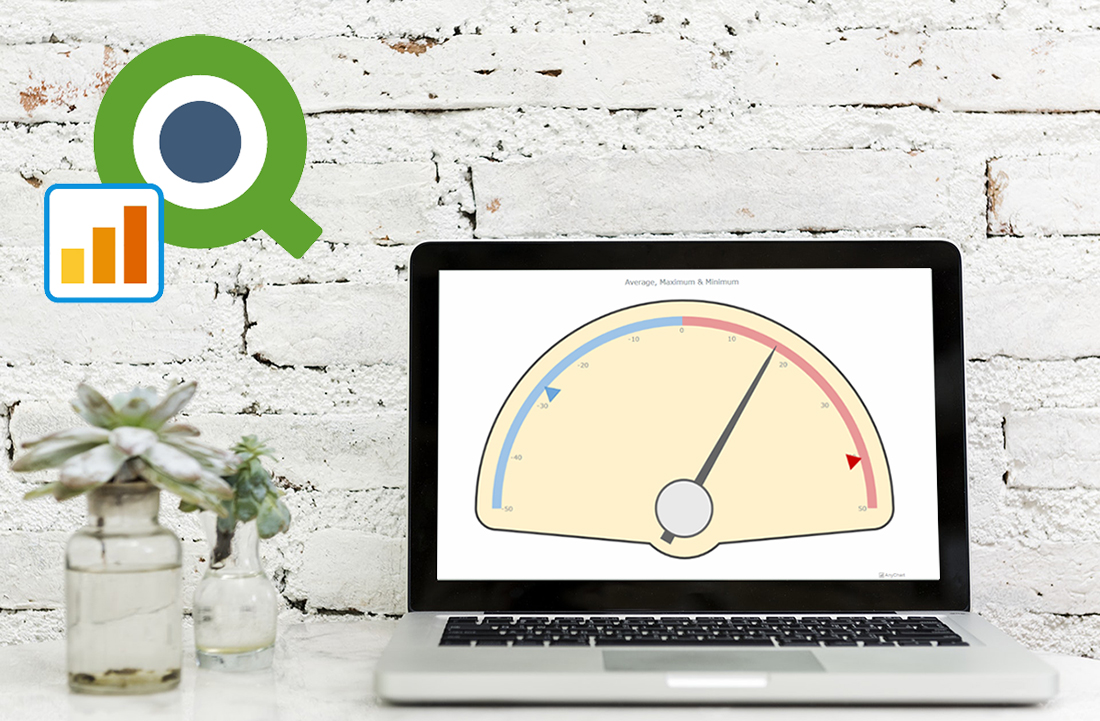
The latest update adds two new chart types – Linear and Circular Gauges – as well as several new important features, further extending the power of our JavaScript charting libraries to the Qlik Sense environment. Check out the details in a quick overview below.
New Chart Types for Qlik Sense
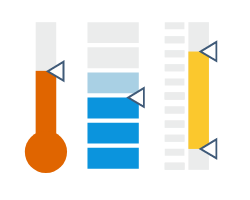 |
Linear GaugesLinear Gauge is designed for visualization of tools with a linear scale: thermometers, LEDs (color indicators), tanks, etc. In this chart type, data values are displayed on the axis with the help of markers, pointers or ranges. |
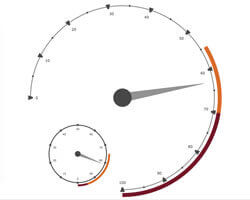 |
Circular GaugesCircular Gauge is a type of gauges with a radial scale: speedometers, voltmeters, ammeters, etc. As with the Linear Gauge chart type, data values in Circular Gauges are also displayed on the axis with the help of a marker, a pointer or a range. |
New Charting Features for Qlik Sense
Data Field Tokens
Data field tokens are now displayed in the Connected Data Set section.
The {%dimensionN} or {%measureN} tokens can be used in data labels format, tooltip titles and caption.
Lock Series Name Feature
By default, names of series are label values of the corresponding measures or dimensions.
The lock/unlock button is now added to the Series Name field so you can switch this behavior off and set the series name manually.
Multidimensional Behavior
When several dimensions are used, the dimensionGroup field is added to the data row. Its value is the sum value of all the dimensions.
We’ve also fixed the issue with the point selection for multidimensional data.
Migration from Previous Versions of AnyChart Qlik Sense Extension
Once you’ve updated the AnyChart JS Charts’ Qlik Sense extension from version 2.2.0 (or older) to version 2.3.0, you should remap your data. This should be done in the following way:
- Open the Chart Editor by clicking the Run Chart Editor button.
- On the Setup Chart screen, reselect the data fields for each of the series.
- Click the Next button.
- Click the Complete button.
All the previous settings of your chart will be retained.
***
Enjoy AnyChart Qlik Sense extension 2.3.0! If you have any special needs and would like to see a new chart type or feature and you do not see it in our roadmap for this product, please let us know in the comments or by contacting our Support Team, and we will do our best to deliver it soon!
- Categories: AnyChart Charting Component, HTML5, JavaScript, News, Qlik
- No Comments »