 When AnyChart JS Charts‘ dedicated extension for Qlik Sense first hit the stage on Qlik Branch in the spring of 2017, it was well received by the community. In fact, we delivered what many Qlik users craved: advanced flexibility which at the same time would not affect the ease of interactive data visualization. And that was just the beginning.
Now, we are happy to present version 2.0 of our extension for Qlik Sense!
The major update has brought new chart types and elaborate features out of the box, sharing another portion of the ultimate data visualization power inherent in the AnyChart JavaScript charting library with Qlik users.
What’s New in Version 2.0
Version 1.0 of the AnyChart extension for Qlik Sense delivered multiple types of charts and series as well as charting features out of the box from the very beginning. Version 2.0 greatly extends the range of available opportunities.
General Improvements
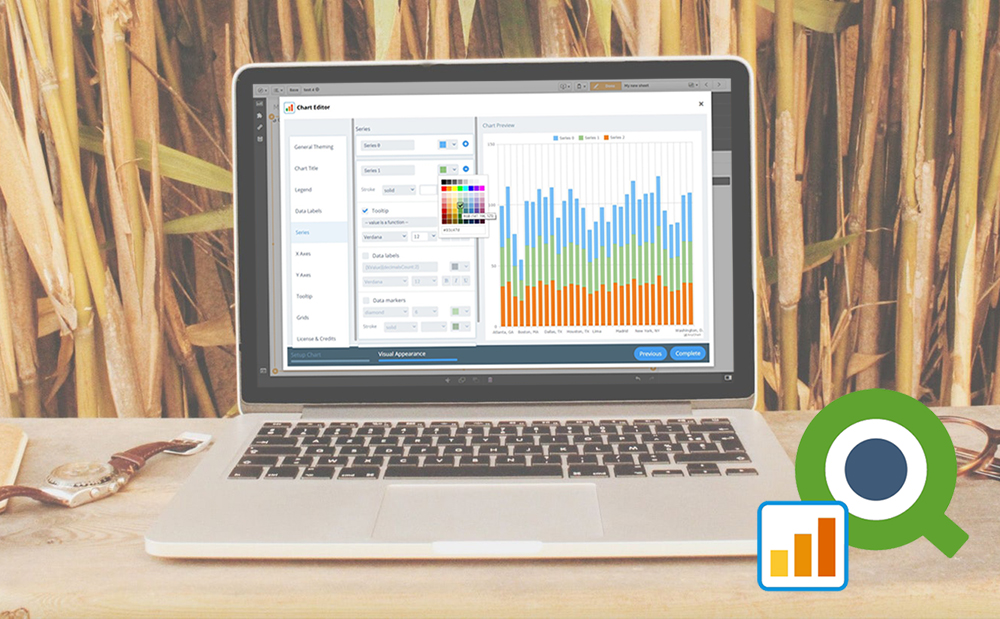
1. New Chart Building Interface
The AnyChart extension for Qlik Sense now features a brand new intuitive chart building interface. It is based on our own out-of-the-box Chart Editor providing the easiest way to quickly visualize data. Chart Editor is currently under development as a special product of AnyChart and will be released as a separate embeddable solution soon.
2. Multiple Measures
Now you can add as many dimensions and measures as you want. This will allow you to build multi-series charts as well as use custom attributes to format text and configure chart settings.
3. License Settings in Plugin
License and credits settings for all the applications you are developing can now be specified only once, in the credits.js file supplied in the plugin’s archive.
New Chart Types
In addition to multiple basic chart types available already in version 1.0 of the AnyChart extension for Qlik Sense, the 2.0 update delivered many new ones. The newcomers are listed below. All the items on the list are provided with links to the corresponding articles in Chartopedia so you can learn more about each chart type and how to best use one.
- Heat Map.
- Box Chart.
- Stacked Area Chart and Percent Stacked Area Chart.
- Stacked Bar Chart and Percent Stacked Bar Chart.
- Stacked Column Chart and Percent Stacked Column Chart.
- Funnel Chart.
- Stock Chart.
- Choropleth Map.
- Bubble Map.
- Dot (Marker) Map.
New Charting Features
The feature newly available in version 2.0 ensure even more flexibility for interactive data visualization in Qlik Sense thanks to the AnyChart JS Charts extension.
1. Chart Title Settings
In version 2.0, the chart title can be tuned in terms of format, color, positioning, font and background settings.
2. Data Point Label Settings
Basically, the same that we’ve just said about the chart title goes for data point labels as they are now likewise customizable using format, color, positioning, font and background settings.
3. Data Point Marker Settings
Size, shape and positioning of data point markers can now be adjusted.
4. Series Settings
We’ve also extended the series settings available in our extension for Qlik Sense. Now it is possible to change color as well as turn on (and off) data labels, data markers and tooltips.
5. Grid Settings
The design of grids can be customized by setting the color of gridlines, choosing an interlace fill palette, turning on (and off) the first and (or) the last lines.
Try AnyChart Extension 2.0 for Qlik Sense Now
We invite all Qlik Sense users to try our new extension right away! Also, we are working hard on getting you even more features and types of charts. In the next version – 2.1 – we are going to deliver Waterfall Chart, Mekko Chart, Treemap Chart, Radar Chart and Polar Chart types. However, we are always listening to you first, our customers, so please feel free to tell us what other new chart types, features and improvements you would like to get. We will be glad to see what we can do and there are always good chances that we will deliver what you are looking for in one of the next versions.
Any questions, comments or feature suggestions, please contact our Support Team or simply comment right here below.
Enjoy the AnyChart extension for Qlik Sense, now in version 2.0!
- Categories: AnyChart Charting Component, Business Intelligence, HTML5, News, Qlik
- 1 Comment »