 The time has come for another major update of our JavaScript chart libraries, recognized the best in JavaScript technologies earlier this year!
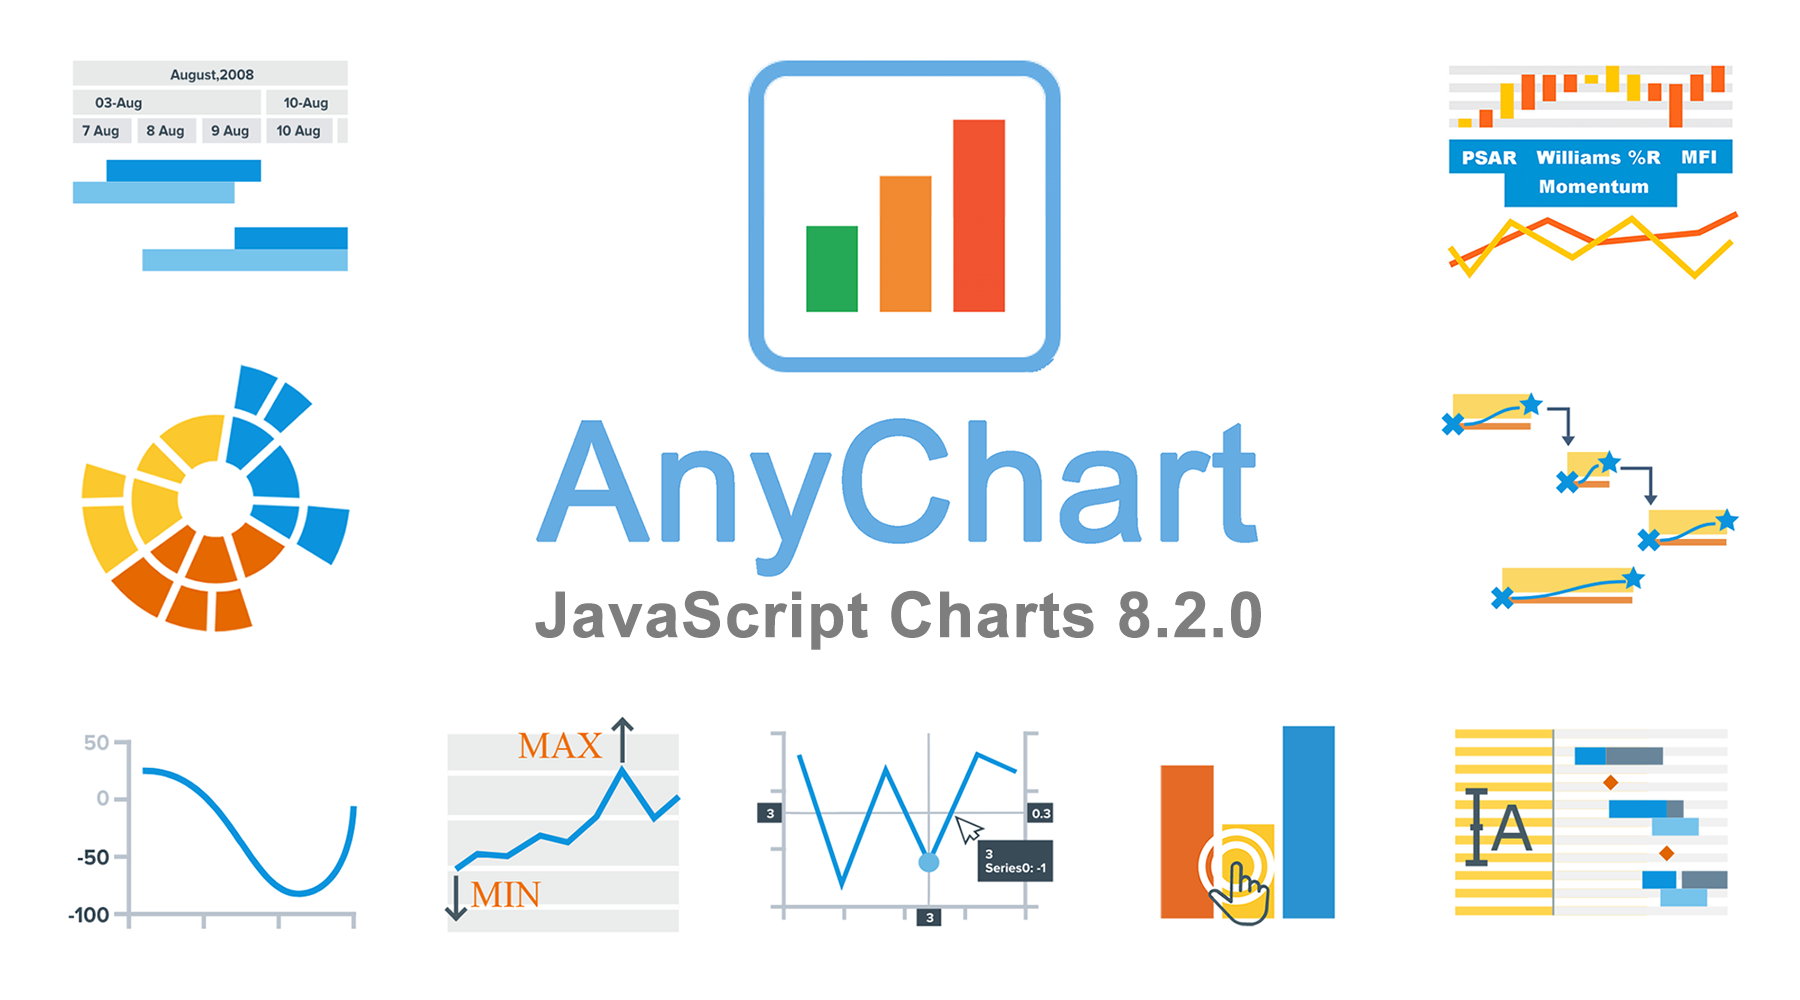
Meet version 8.2.0 of AnyChart, AnyStock, AnyGantt and AnyMap!
To start with, here’s a quick list of what major new cool features have been delivered to our interactive data visualization solutions with this new release:
- Sunburst Chart;
- negative logarithmic scale;
- crosshair multiple labels;
- minimum/maximum labels;
- new technical indicators and additional touch support in stock charts;
- custom drawing, data grid live editor, and new timeline in Gantt charts
Now, let’s take a closer look at each of the major news of AnyChart 8.2.0 and then see what’s next on our roadmap.
Major New Features in AnyChart 8.2.0
 |
Sunburst ChartIn addition to a lot of chart types already available in the AnyChart JavaScript chart library out of the box, we’ve added the Sunburst Chart (also called Radial Treemap). It presents an excellent way of visualizing hierarchical data by means of concentric circles. See the Sunburst Chart examples in our gallery, and Sunburst Documentation. |
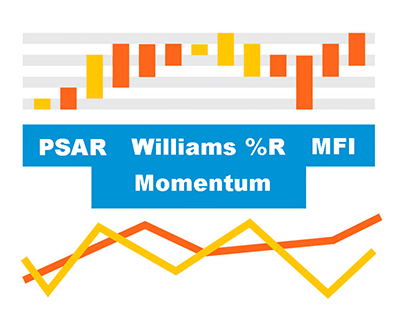 |
New Technical IndicatorsA new bunch of technical indicators is now available in the AnyStock JS library for financial data visualization: Parabolic SAR (PSAR), Money Flow Index (MFI), Momentum, and Williams %R. See the AnyStock roadmap to learn which ones are planned for release with the following major updates. Check out multiple examples of stock charts with technical indicators in our gallery. |
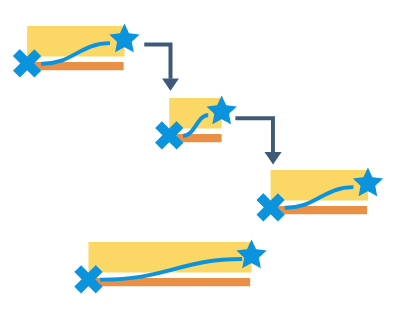 |
Custom Drawing in Gantt ChartsWe’ve made it possible to override drawing of any Gantt timeline element (baseline, milestone, etc.). There are no limits to how they can look, you can create any custom visualization based on your imagination. |
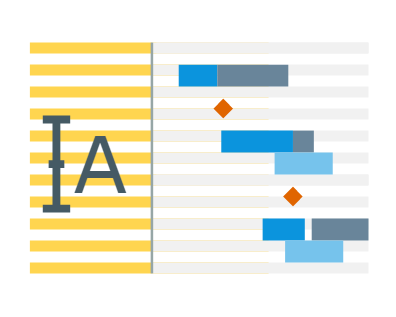 |
Data Grid Live EditorGrid cells of the Gantt Chart can now be edited in the Live Edit mode. If the input data is valid, all the changes can be saved or aborted if otherwise. |
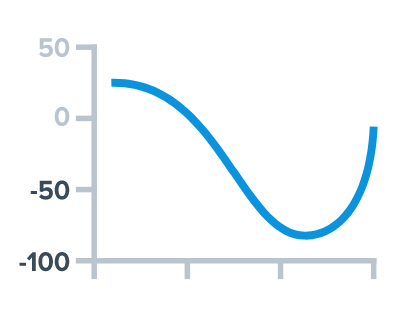 |
Negative Logarithmic ScaleIn release 8.2.0, we’ve introduced the support of negative values on the logarithmic scale in basic charts (AnyChart) and stock charts (AnyStock). This can be helpful in creating a clearer and more comprehensive visualization when working with large data sets. |
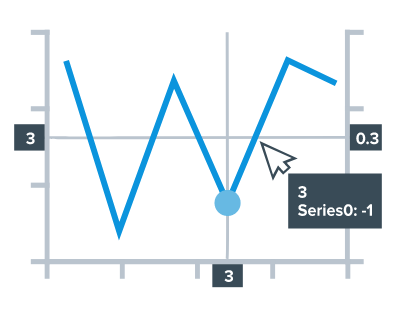 |
Crosshair Multiple LabelsNow you can display several crosshair labels on additional axes of the chart in basic charts, stock charts, and map charts, i.e. in the AnyChart, AnyStock and AnyMap JavaScript chart libraries respectively. Hence, it is possible to add an extra axis (e.g. one with percentage values), enable this feature and get more insights at a time while exploring such an interactive data visualization. |
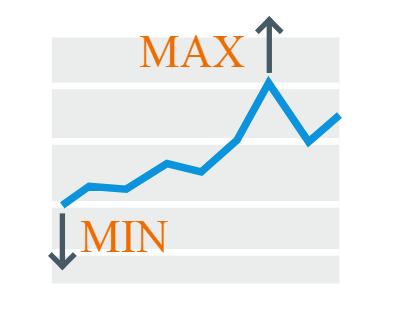 |
Minimum/Maximum LabelsMin/Max labels give you a unique opportunity to show the minimum and maximum values on basic (AnyChart) and stock charts (AnyStock). This feature allows users to see at a glance what is happening with the data. Take a look at our examples: Min and Max Labels in Range Column Chart and Min and Max Labels in Stock Chart, and Minimum/Maximum Labels Docs. |
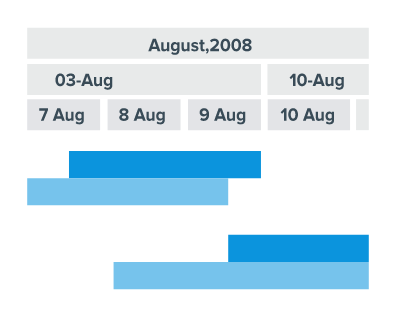 |
New Timeline in Gantt ChartsRelease 8.2.0 has brought significant improvements to the timeline header in Gantt charts. From now on, the number of its levels and their format can be set manually, which further increases the timeline’s flexibility. In addition, automatic formatting of dates in response to zoomIn and zoomOut has become even better. |
 |
Additional Touch Support in Stock ChartsWe are glad to announce that touch support in AnyStock has been further extended! Now you can use the touchscreen to easily pinch stock charts (or any other timeline-based data visualizations) and scroll them in any direction. |
Other Improvements in AnyChart’s JavaScript Chart Libraries
With release 8.2.0, we have also made a number of other improvements to our JavaScript chart libraries, not to mention important bug fixes.
For more details on what exactly has been updated, please head to the library-specific version history sections on our website:
- AnyChart version history;
- AnyGantt version history;
- AnyMap version history;
- AnyStock version history.
AnyChart JS Charts 8.3.0 to Be Released in June 2018
The next version of AnyChart’s JavaScript chart libraries is scheduled for release in June 2018. Here’s what we are going to add in version 8.3.0:
- support of HTML tooltips, extended fill/stroke functions, and localization improvements in all our JS chart libraries,
- axis labels inside charts in AnyChart and AnyStock,
- multilevel X-axis in AnyChart,
- axis markers and plotting a custom chart title in AnyStock,
- major API improvements in AnyGantt, and
- maybe something else — please let our Support Team know what you would like to get in the next release, and we may well decide to roll it out within the nearest or one of the following updates!
Library-specific roadmaps will tell you more not only about the upcoming major release but also about what’s in our long-term plans:
Thank you for choosing AnyChart, an award-winning JavaScript (HTML5) based solution for interactive data visualization!
- Categories: AnyChart Charting Component, AnyGantt, AnyMap, AnyStock, Financial Charts, Gantt Chart, HTML5, JavaScript, News, Stock Charts
- 2 Comments »