AnyChart’s Co-Founder Timothy Loginov Named Top Creative Leader Innovating in Business 2019
June 24th, 2019 by AnyChart Team Business magazine Insights Success featured AnyChart‘s co-founder Timothy Loginov as one of the Top Creative Leaders Innovating in Business 2019! Today we are republishing an engaging two-page article that illuminates his journey from a freelance technical writer to a successful tech entrepreneur, outlines how our company has developed into a global leader in data visualization tools, and summarizes meaningful lessons and tips for emerging entrepreneurs.
- Categories: AnyChart Charting Component, News, Success Stories
- No Comments »
All 3 Extensions for Qlik Sense Updated with New Charting Features in Version 3.4
June 19th, 2019 by AnyChart Team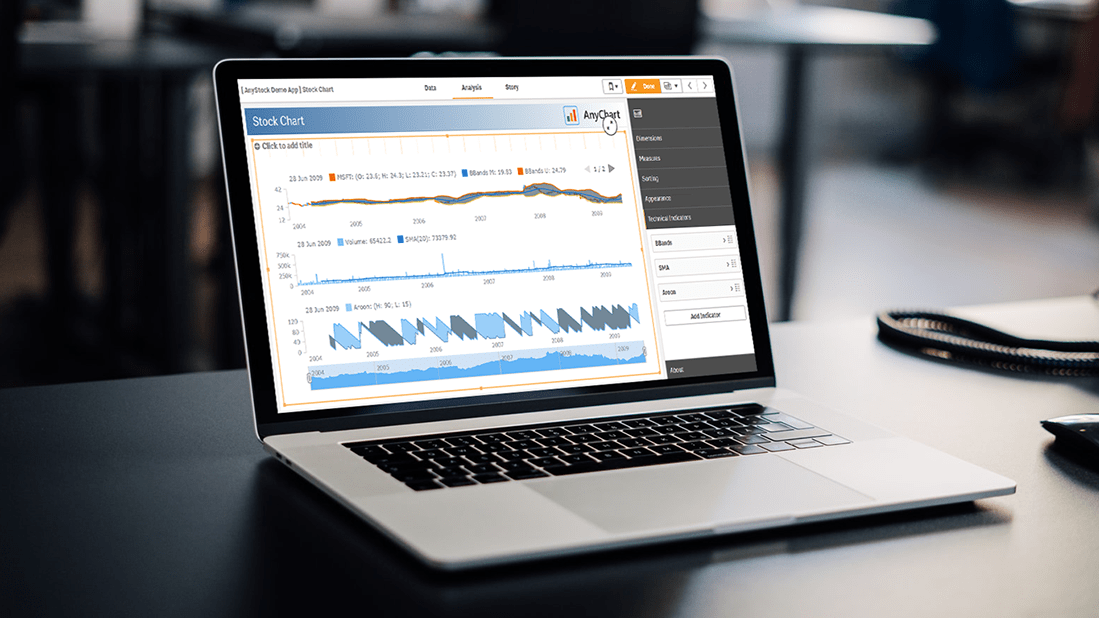 Hey Qlik users, we are happy to announce the release of version 3.4 for all our three extensions for Qlik Sense! We updated them with new awesome data visualization features and functionality such as technical indicators and more.
At last month’s Qlik Qonnections 2019 conference in Dallas where we exhibited as a new Qlik Technology Partner, we received amazing feedback from the Qlik community. We took that information and have already begun building out some of those requests for our next release of version 3.5 for our extensions for Qlik Sense, so please keep the feedback coming and we’ll keep building.
In the meantime here’s what we added.
Read more at qlik.anychart.com »
- Categories: AnyChart Charting Component, AnyGantt, AnyMap, AnyStock, Business Intelligence, Gantt Chart, Qlik, Stock Charts
- No Comments »
JS Charts Library AnyChart Adds Timeline Chart and Network Graph in Version 8.6.0
May 15th, 2019 by AnyChart Team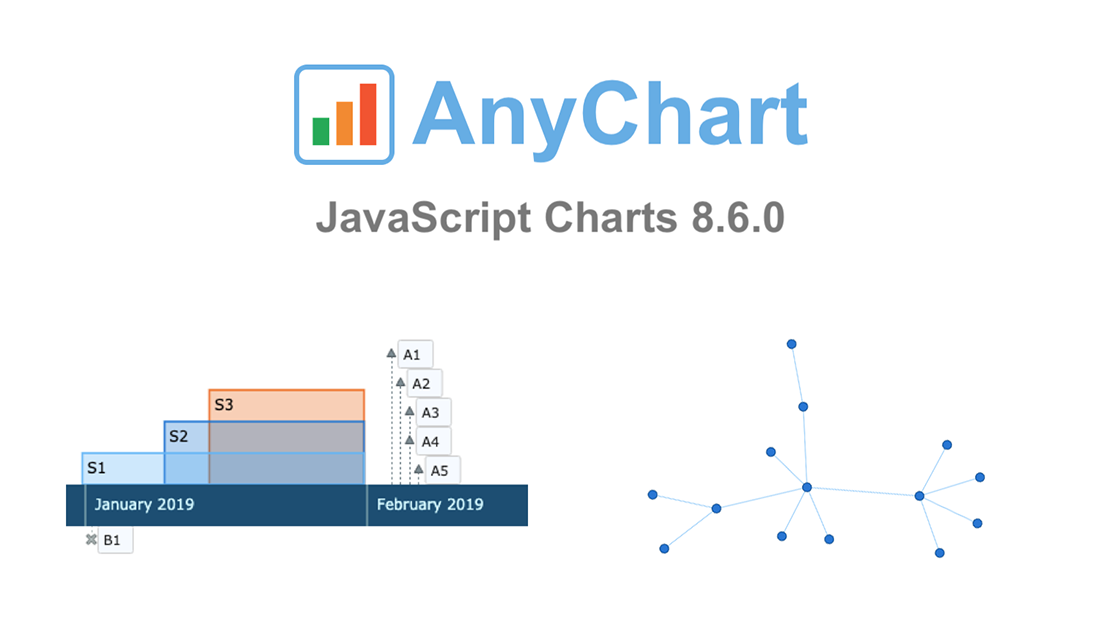 AnyChart 8.6.0 is out! Check out what new awesome interactive data visualization features we’ve added to our award-winning JS charts library!
First and foremost, two new chart types are now available out of the box — greet the main protagonists of the 8.6.0 release:
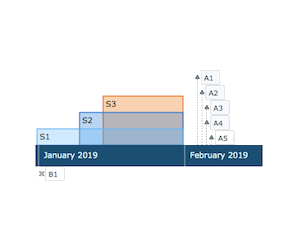 |
Timeline Chart in AnyChart JS Charts LibraryTimeline Chart is used to display a set of events in chronological order. It is typically a graphic design showing a long bar labeled with dates paralleling it, and usually contemporaneous events. Look at interactive Timeline Chart examples in our gallery. Read AnyChart Docs to learn how to create a JS Timeline Chart using our library. |
 |
Network Graph in AnyChart JS Charts LibraryNetwork Graph, also Graph Chart, is a mathematical structure (graph) designed to show relationships between data points. This chart type visualizes how entities are interconnected with each other. Entities are displayed as nodes (points). Relationship between them (edges) are depicted as lines. Check out interactive Network Graph examples in our gallery. Read AnyChart docs to learn how to create a JS Network Graph using our library. |
Then, the new major release AnyChart JS Charts 8.6.0 is bringing multiple other improvements, not to mention bug fixes.
Take a look into what’s new, by product:
Let us know if you have requests for new JS chart types or data visualization features. Contact our Support Team with all your tips and suggestions, and we’ll be happy to consider quickly delivering what you need. As always, you know.
Enjoy AnyChart 8.6.0!
- Categories: AnyChart Charting Component, AnyGantt, AnyMap, AnyStock, HTML5, JavaScript, News
- 1 Comment »
AnyChart Joins Qlik Technology Program and Adds 36 Chart Types to Qlik Sense in Just-Launched Extensions
May 7th, 2019 by AnyChart Team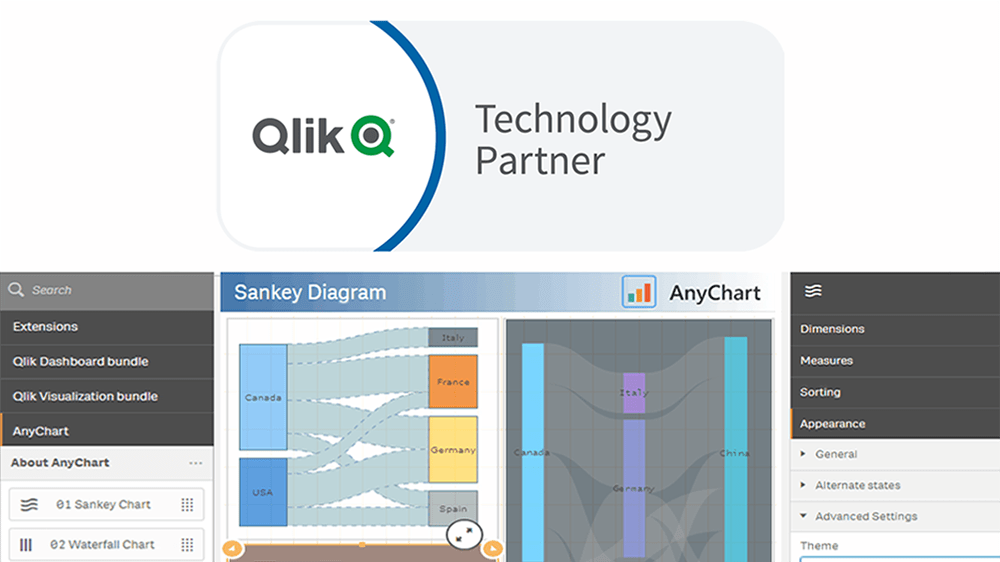
“We’re excited to be partnering with AnyChart, and their extensions will provide customers with additional choices for building even more compelling visualizations.”
— Mike Foster, Vice President, Strategic Partners at Qlik.
(Source: press release as of May 7, 2019.)
AnyChart crosses a new frontier! The vast data visualization capabilities of our award-winning JavaScript charting library, designed primarily for web developers and software engineers, are now available directly to data analysts and BI experts through powerful, flexible, intuitive extensions for Qlik Sense — AnyChart, AnyGantt, and AnyStock!
Read more at qlik.anychart.com »
- Categories: AnyChart Charting Component, AnyGantt, AnyStock, Big Data, Business Intelligence, Qlik
- 13 Comments »
FinancesOnline Honors AnyChart Data Visualization Software with Premium Usability and Rising Star Awards
April 23rd, 2019 by AnyChart Team At AnyChart, we believe that companies and organizations should be able to leverage their data without having to waste time on trying to make sense of raw digits and vast spreadsheets. This is why we worked hard to create a no-fuss interactive data visualization software that does not compromise flexibility while giving everyone a unique chance to visualize any data in any way they want and make correct data-driven decisions they need in an instant. It is for this reason that FinancesOnline, a reputable business directory, has included our charting solution in their list of the top data visualization tools and granted us the Premium Usability Award and the Rising Star Award for 2019!
- Categories: AnyChart Charting Component, News
- No Comments »
Interesting Visualizations on Russia’s Borders, Paths to Congress, Child Time, News Lifespan — DataViz Weekly
February 1st, 2019 by AnyChart Team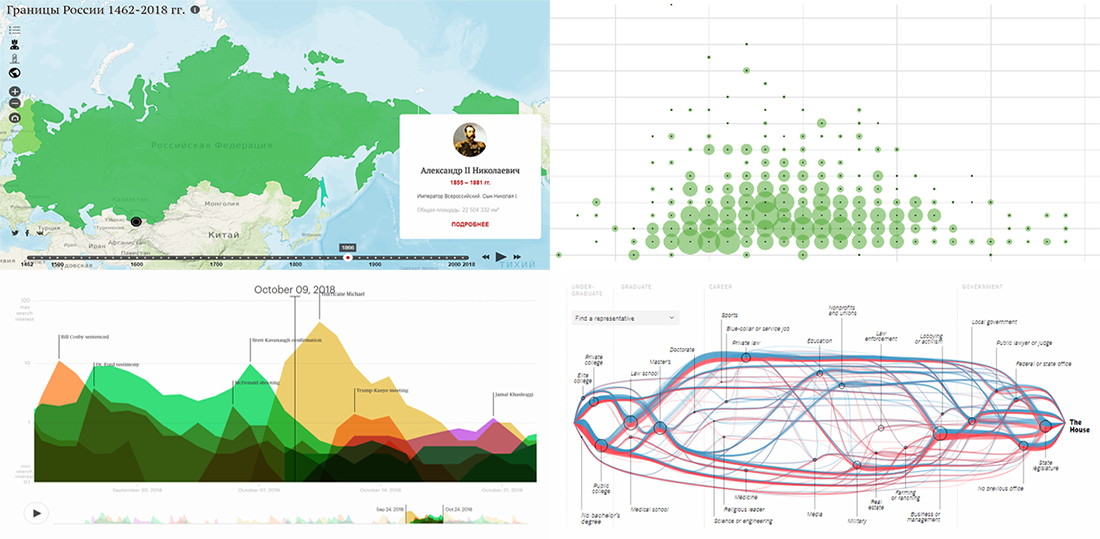 DataViz Weekly is here to meet you with some of the interesting visualizations we’ve come across these days. The new selection includes data-based projects worth seeing, with charts and infographics on the following topics:
- Russian borders from 1462 through 2018;
- career paths to the U.S. Congress;
- time to have the first child;
- lifespan of news stories.
- Categories: Data Visualization Weekly
- No Comments »
Qlik Data Visualization Extension: Introducing Custom Drawing Over Custom Theme
January 16th, 2019 by Irina Maximova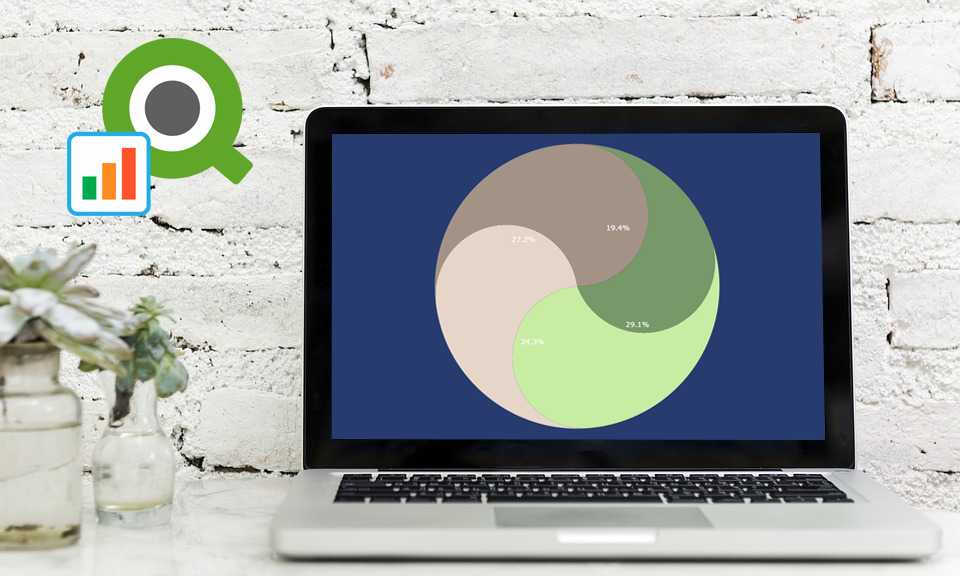 Our Qlik Charts Extension now allows a custom renderer to be set for certain chart types! We’ll show you how to make use of this new great feature in your Qlik data visualization practice, implementing custom drawing over a custom theme.
Before we begin, please note: We recommend getting acquainted with the custom drawing documentation of AnyChart JS Charts if you never worked with it before. When you do that, it will be easier for you to understand what the custom drawing functions are and how to use them right and best.
- Categories: AnyChart Charting Component, Business Intelligence, HTML5, News, Qlik, Tips and Tricks
- No Comments »
Qlik Extension Gets Gantt Chart and Tag Cloud in Version 2.5.0
November 6th, 2018 by AnyChart Team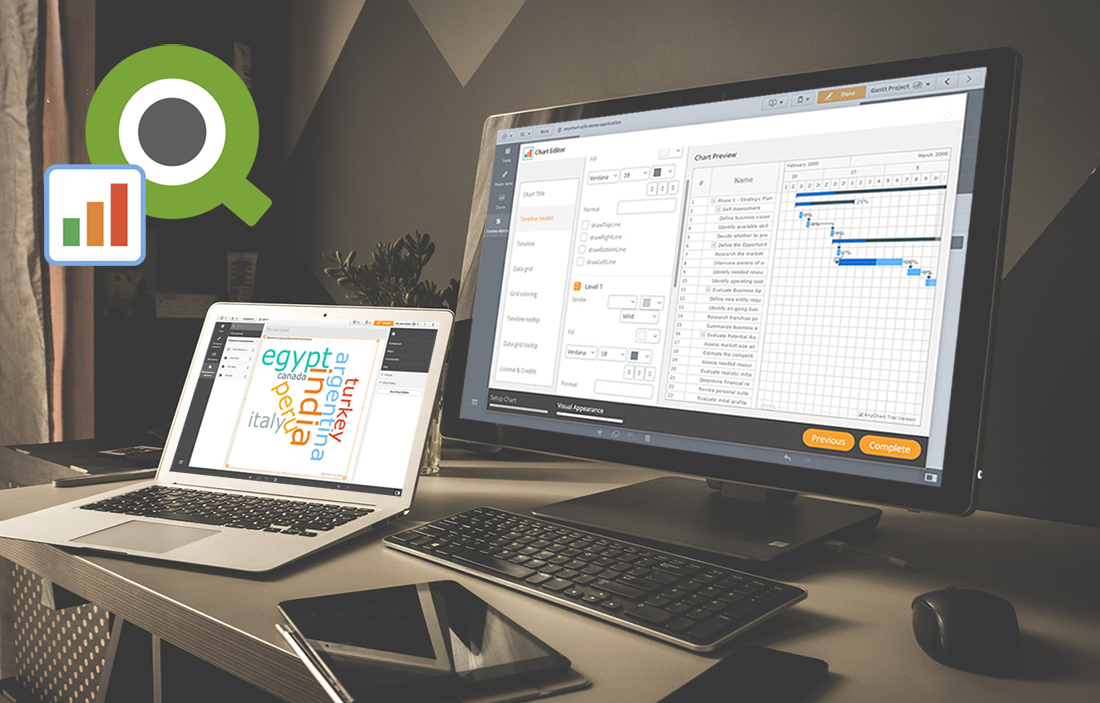 Following the 8.4.0 release of the AnyChart JS Charts library, now we’ve also got an awesome major update for our data visualization extension for Qlik Sense. Its version 2.5.0 is already available, adding Gantt Chart and Tag Cloud to the list of supported chart types.
Meet AnyChart Qlik Extension 2.5.0!
- Categories: AnyChart Charting Component, Qlik
- No Comments »
JS Sankey Diagram and Other Improvements in AnyChart 8.4.0 Released Just Now
October 8th, 2018 by AnyChart Team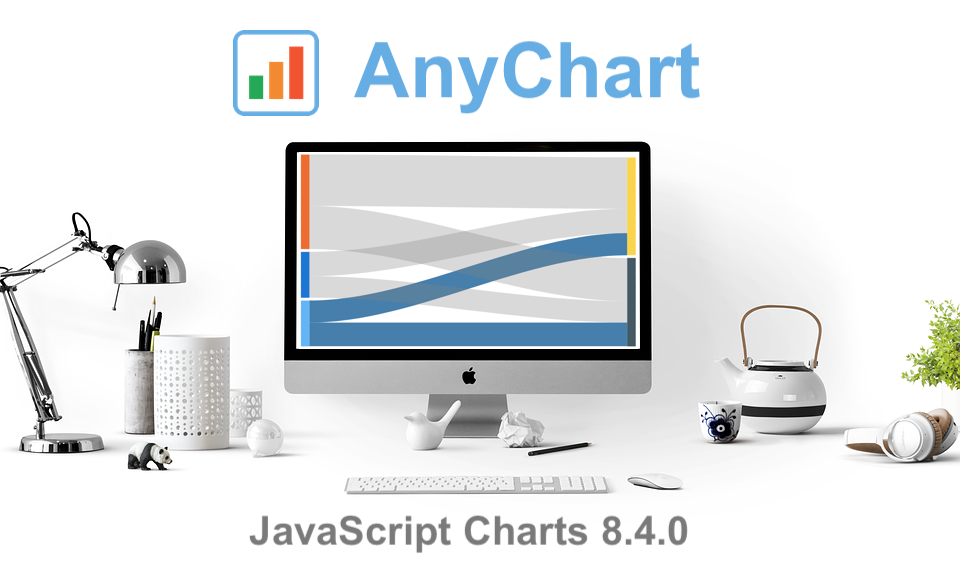 The year’s third major update for AnyChart is out, featuring the JS Sankey Diagram chart type as the ultimate centerpiece of the new release.
Learn more about AnyChart 8.4.0 and start making use of our updated JavaScript (HTML5) libraries for interactive data visualization right away.
- Categories: AnyChart Charting Component, AnyGantt, AnyMap, AnyStock, HTML5, JavaScript
- 1 Comment »
JS Chart Libraries Get New Great Features in 8.3.0 Release of AnyChart, AnyStock, AnyMap and AnyGantt
July 10th, 2018 by AnyChart Team We at AnyChart are proud to announce the 8.3.0 release of our JS chart libraries AnyChart, AnyStock, AnyGantt, and AnyMap! The present major update brings full support of HTML in tooltips, background settings for chart data bounds, coloring rules and thresholds, easy axis label positioning, new technical indicators, and even more.
- Categories: AnyChart Charting Component, AnyGantt, AnyMap, AnyStock, Financial Charts, Gantt Chart, HTML5, JavaScript, News, Stock Charts
- 6 Comments »