AnyChart Triumphs Again: Awarded Best in Data Analytics and Visualization in 2024
February 19th, 2024 by AnyChart Team We are delighted to announce that AnyChart has won the prestigious 2024 DEVIES Awards in the Data Analytics & Visualization category, marking our victory for the second consecutive year!
The award celebrates our JavaScript charting library, continuously acknowledged as the world’s leading data visualization solution for developers. As AnyChart JS forms the cornerstone of our broader product line, this recognition once again highlights the technological excellence and innovation inherent in our entire suite of offerings, including the extensions for Qlik Sense.
- Categories: AnyChart Charting Component, AnyGantt, AnyMap, AnyStock, Big Data, Blogroll, Business Intelligence, Dashboards, Financial Charts, Gantt Chart, HTML5, JavaScript, News, Oracle Apex, Qlik, Stock Charts, Success Stories
- No Comments »
AnyChart Named Best in Data Analytics & Visualization ?
February 3rd, 2023 by AnyChart Team We’re proud to announce that AnyChart has won a prestigious 2023 DEVIES Award in the Data Analytics & Visualization category! Many thanks to the jury and congratulations to all our partners and customers!
Celebrating 20 years in the market this year, we at AnyChart have been working hard to develop the best-in-class data visualization solutions. And we will keep innovating and excelling!
The DEVIES Awards are the definitive annual awards for the software industry, recognizing outstanding design, engineering, and innovation in developer technology across multiple categories. This year’s winners were selected from record-high hundreds of nominations by an expert-led panel of the DevNetwork Advisory Board, including representatives of Accenture, DigitalOcean, EA, Google, IBM, Salesforce, and other great companies.
- Categories: AnyChart Charting Component, AnyGantt, AnyMap, AnyStock, Big Data, Business Intelligence, Dashboards, Financial Charts, Gantt Chart, GraphicsJS, HTML5, JavaScript, News, Oracle Apex, Qlik, Stock Charts, Success Stories
- 2 Comments »
AnyChart’s CEO Anton Baranchuk Among the Most Innovative Business Leaders Revamping the Future
May 18th, 2021 by AnyChart Team Anton Baranchuk, our CEO, has been recognized by CIOLook Magazine as one of the 10 Most Innovative Business Leaders Revamping the Future! Great news and congratulations to the boss!
Right now, we are excited to share with you the story of his success with AnyChart, the company he co-founded when pursuing a Ph.D. back in 2003 that turned from a small startup to a global data visualization software market leader. This article is published in the dedicated special edition of CIOLook and we are thankful for the opportunity to repost it on our blog.
- Categories: AnyChart Charting Component, News, Success Stories
- No Comments »
AnyChart Recognized in Top 10 Business Intelligence and Analytics Companies of 2019
November 19th, 2019 by AnyChart Team We are excited to announce that Analytics Insight, a magazine that covers big data and business intelligence developments, included AnyChart in The 10 Next Generation BI and Analytics Companies of 2019 — “for providing the most advanced solutions and playing a significant role in shaping the future of these disruptive technologies.”
The list has been made public in the just-released November issue of the magazine and is accompanied by the stories about each featured company. With permission of Analytics Insight, today we are republishing the magazine’s story about us on our blog — “AnyChart: Turning Data into Actionable Insights with Award-Winning Data Visualization Solutions.”
Read the story of AnyChart as it appeared on Analytics Insight »
- Categories: AnyChart Charting Component, AnyGantt, AnyMap, AnyStock, Big Data, Business Intelligence, Charts and Art, Dashboards, Financial Charts, Flash Platform, Gantt Chart, GraphicsJS, HTML5, Interesting Facts, JavaScript, News, Success Stories
- No Comments »
AnyChart CEO Anton Baranchuk Named One of Most Promising CEOs of 2019
August 13th, 2019 by AnyChart Team Insights Success magazine has named Anton Baranchuk, CEO and Co-founder of AnyChart, one of The Most Promising CEOs of 2019. Celebrating this exciting recognition, we are pleased to share with you a special article about him and our company. Published in the latest issue of Insights Success, the story is based on Anton’s recent interview with the magazine. Take a read.
- Categories: AnyChart Charting Component, News, Success Stories
- No Comments »
AnyChart’s Co-Founder Timothy Loginov Named Top Creative Leader Innovating in Business 2019
June 24th, 2019 by AnyChart Team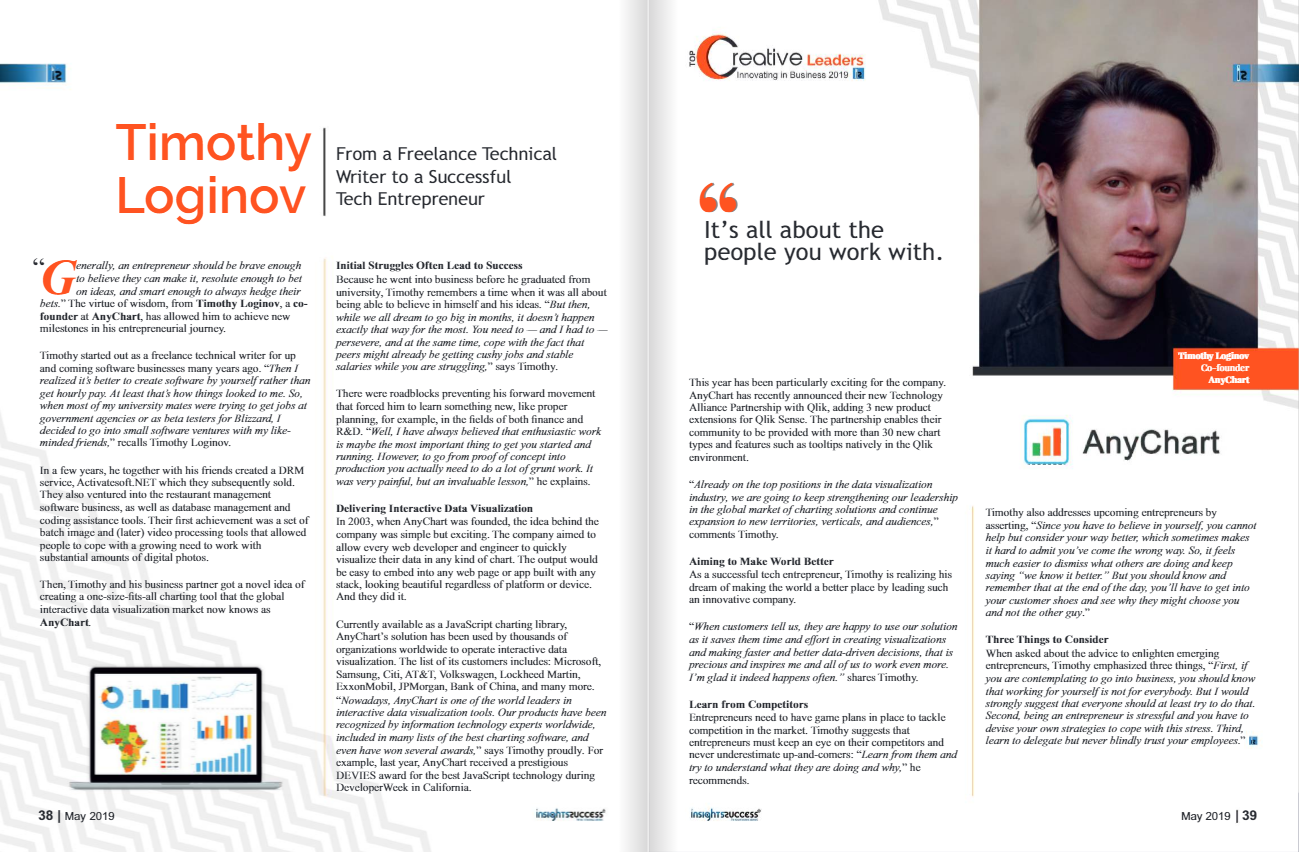 Business magazine Insights Success featured AnyChart‘s co-founder Timothy Loginov as one of the Top Creative Leaders Innovating in Business 2019! Today we are republishing an engaging two-page article that illuminates his journey from a freelance technical writer to a successful tech entrepreneur, outlines how our company has developed into a global leader in data visualization tools, and summarizes meaningful lessons and tips for emerging entrepreneurs.
- Categories: AnyChart Charting Component, News, Success Stories
- No Comments »
FinancesOnline Honors AnyChart Data Visualization Software with Premium Usability and Rising Star Awards
April 23rd, 2019 by AnyChart Team At AnyChart, we believe that companies and organizations should be able to leverage their data without having to waste time on trying to make sense of raw digits and vast spreadsheets. This is why we worked hard to create a no-fuss interactive data visualization software that does not compromise flexibility while giving everyone a unique chance to visualize any data in any way they want and make correct data-driven decisions they need in an instant. It is for this reason that FinancesOnline, a reputable business directory, has included our charting solution in their list of the top data visualization tools and granted us the Premium Usability Award and the Rising Star Award for 2019!
- Categories: AnyChart Charting Component, News
- No Comments »
AnyChart Blog Named in 50 Best Data Visualization Blogs to Follow in 2019
April 10th, 2019 by AnyChart Team Yay, AnyChart Blog with our flagship regular feature DataViz Weekly has made it to the Top 50 Data Visualization Blogs and Websites To Follow in 2019! Curated by Feedspot, this newly updated list ranks our blog as high as second — right next to Nathan Yau’s brilliant blog FlowingData deservedly occupying the first place among the best data visualization blogs.
- Categories: News
- 1 Comment »
Best JavaScript Technology: AnyChart JS Charts Library Wins 2018 DEVIES Award!
February 6th, 2018 by AnyChart Team It’s happened! Our AnyChart JS Charts library has just been officially named the best in JavaScript Technology for innovation and received a prestigious DEVIES award in California! (See all the 2018 DEVIES winners — one for each of the 15 categories.)
2018 DEVIES is reported to be the world’s leading DevTech Awards event, taking place these days during DeveloperWeek in Oakland, CA, the largest developer expo and conference series globally.
- Categories: AnyChart Charting Component, AnyGantt, AnyMap, AnyStock, HTML5, JavaScript, News, Qlik, Success Stories
- 6 Comments »
AnyChart Wins 2017 Devies Award for Best JavaScript Technologies (PHOTO)
February 14th, 2017 by AnyChart Team We are proud to tell you today that our company AnyChart has won the JavaScript Technologies category at the 2017 Devies Awards! The ceremony took place yesterday in San Francisco, CA, as part of DeveloperWeek, the world’s largest developer conference and expo with 8,000 attendees. Our CEO Anton Baranchuk received the award on behalf of the AnyChart team.
The DeveloperWeek Advisory Board received hundreds of nominations and, of course, thoroughly studied how much we did last year. What excited the judges most was the public release of our JavaScript graphics library GraphicsJS. And they concluded that to be last year’s most notable innovation in JavaScript technologies, exceptionally meaningful to the whole web development community.
The Devies Awards celebrate the most innovative companies in the field of developer technologies across 13 categories. Together with AnyChart, among this year’s winners are industry giants Microsoft and IBM.
- Categories: Charts and Art, GraphicsJS, JavaScript, News, Success Stories
- 5 Comments »