 AnyChart 8.6.0 is out! Check out what new awesome interactive data visualization features we’ve added to our award-winning JS charts library!
First and foremost, two new chart types are now available out of the box — greet the main protagonists of the 8.6.0 release:
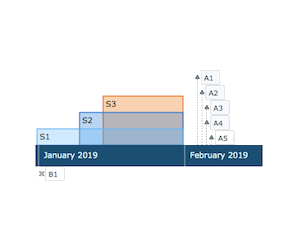 |
Timeline Chart in AnyChart JS Charts LibraryTimeline Chart is used to display a set of events in chronological order. It is typically a graphic design showing a long bar labeled with dates paralleling it, and usually contemporaneous events. Look at interactive Timeline Chart examples in our gallery. Read AnyChart Docs to learn how to create a JS Timeline Chart using our library. |
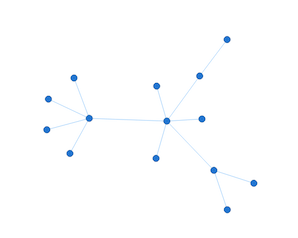 |
Network Graph in AnyChart JS Charts LibraryNetwork Graph, also Graph Chart, is a mathematical structure (graph) designed to show relationships between data points. This chart type visualizes how entities are interconnected with each other. Entities are displayed as nodes (points). Relationship between them (edges) are depicted as lines. Check out interactive Network Graph examples in our gallery. Read AnyChart docs to learn how to create a JS Network Graph using our library. |
Then, the new major release AnyChart JS Charts 8.6.0 is bringing multiple other improvements, not to mention bug fixes.
Take a look into what’s new, by product:
Let us know if you have requests for new JS chart types or data visualization features. Contact our Support Team with all your tips and suggestions, and we’ll be happy to consider quickly delivering what you need. As always, you know.
Enjoy AnyChart 8.6.0!
- Categories: AnyChart Charting Component, AnyGantt, AnyMap, AnyStock, HTML5, JavaScript, News
- 1 Comment »