 The year’s third major update for AnyChart is out, featuring the JS Sankey Diagram chart type as the ultimate centerpiece of the new release.
Learn more about AnyChart 8.4.0 and start making use of our updated JavaScript (HTML5) libraries for interactive data visualization right away.
JS Sankey Diagram
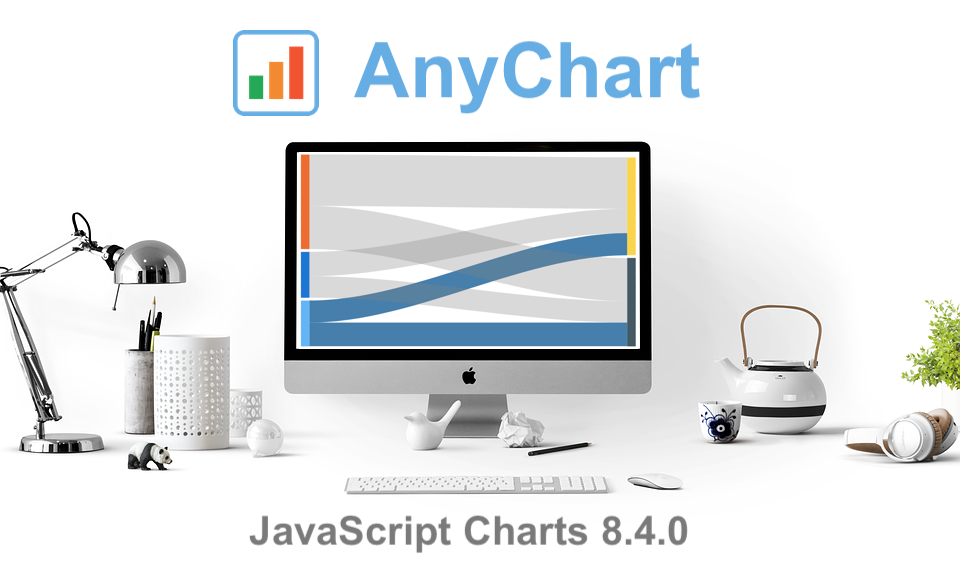
As a specific type of flow diagrams, Sankey Diagram is used to visualize flows — such as the transfer of energy, money, web traffic, and so on — when the flow quantity matters and needs to be considered.
Starting from the 8.4.0 release, Sankey Diagram is available in AnyChart out of the box like dozens of other chart types. Here’s an example:
Learn more about Sankey Diagram in Chartopedia, our awesome guide to chart types. Take a look at other Sankey Diagram examples in the gallery. And see the Sankey Diagram documentation to learn how to easily create such an interactive HTML5 chart using the AnyChart JS library.
Other Improvements
As always, the new release of AnyChart JS Charts also delivers a number of various improvements and bug fixes, including but not limited to (now-solved) issues with performance, legend rendering, label positioning, gradient fill, and more.
Take a look at the version history to find out what’s new in the library(ies) you are using:
- AnyChart (JS charts) version history;
- AnyMap (JS maps) version history;
- AnyStock (stock and financial JS charts) version history;
- AnyGantt (project and resource JS charts) version history.
***
We have already started working on the next major release scheduled for December 2018: AnyChart 8.5.0 will bring a significant performance boost along with multiple other great improvements that will make your JavaScript (HTML5) charting life even happier.
In the meantime, enjoy AnyChart 8.4.0, and feel free to send us your feedback and new feature suggestions — on Twitter, Facebook, LinkedIn, or by getting in touch with our awesome Support Team.
- Categories: AnyChart Charting Component, AnyGantt, AnyMap, AnyStock, HTML5, JavaScript
- 1 Comment »