Visualizing Data on Poverty, Happiness, Music, and Retail — DataViz Weekly
April 9th, 2021 by AnyChart Team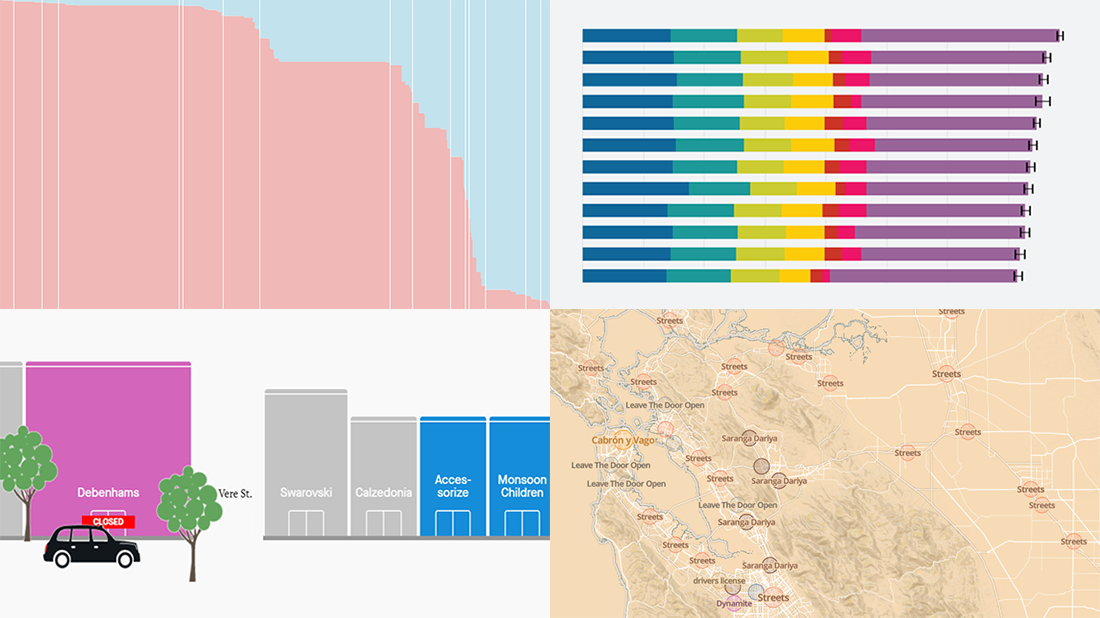 Look at these new exciting examples of data visualizations! We’ve stumbled upon these just recently and are more than happy to present them to you today on DataViz Weekly:
- Share of population with income below the poverty threshold — Our World in Data
- World Happiness Report 2021 — SDSN
- Most popular music in your city and worldwide — The Pudding
- COVID’s impact on retail stores on Oxford St, Rodeo Dr, and Russell St — Quartz
- Categories: Data Visualization Weekly
- No Comments »
Some of Best Visualizations of Recent Days — DataViz Weekly
April 2nd, 2021 by AnyChart Team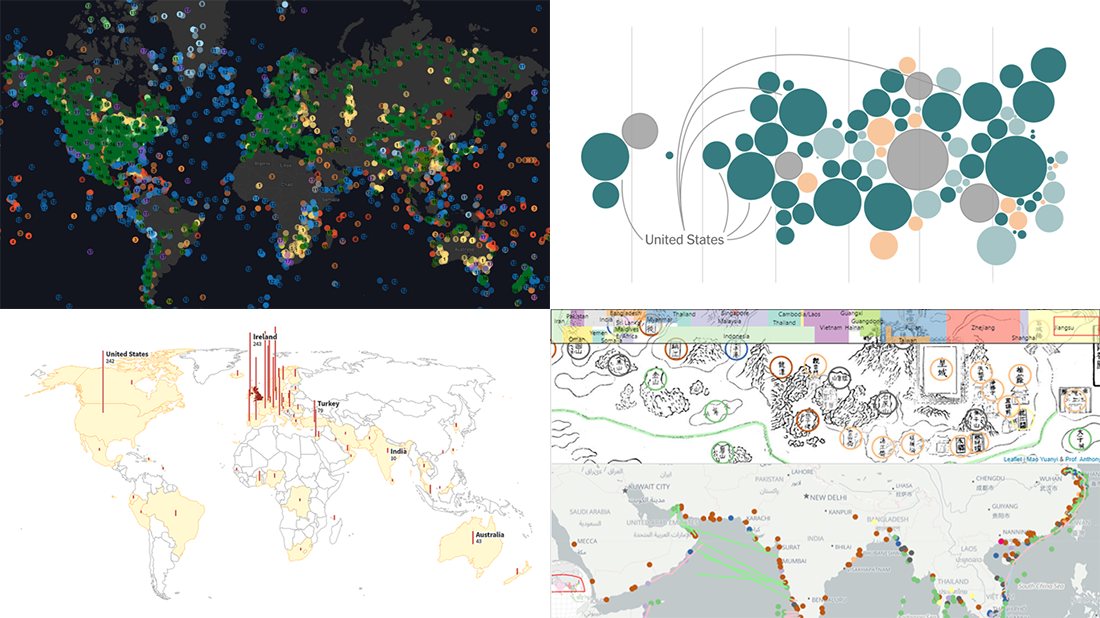 As we continue to bring you regular roundups of the best visualizations we have stumbled upon out there, it’s Friday and DataViz Weekly here! Read next and you’ll meet the following new stunning projects:
- Country wealth and vaccination roll-out — The New York Times
- Spread of the Kent variant across Britain and worldwide — Reuters
- Earth’s сlimate history in proxy data — Carbon Brief
- Interactive Mao Kun map explorer — Ryan Carpenter
- Categories: Data Visualization Weekly
- No Comments »
Analyzing Skin Tones, Pandemic Timeline, Chinese Names, and Dutch Elections — DataViz Weekly
March 19th, 2021 by AnyChart Team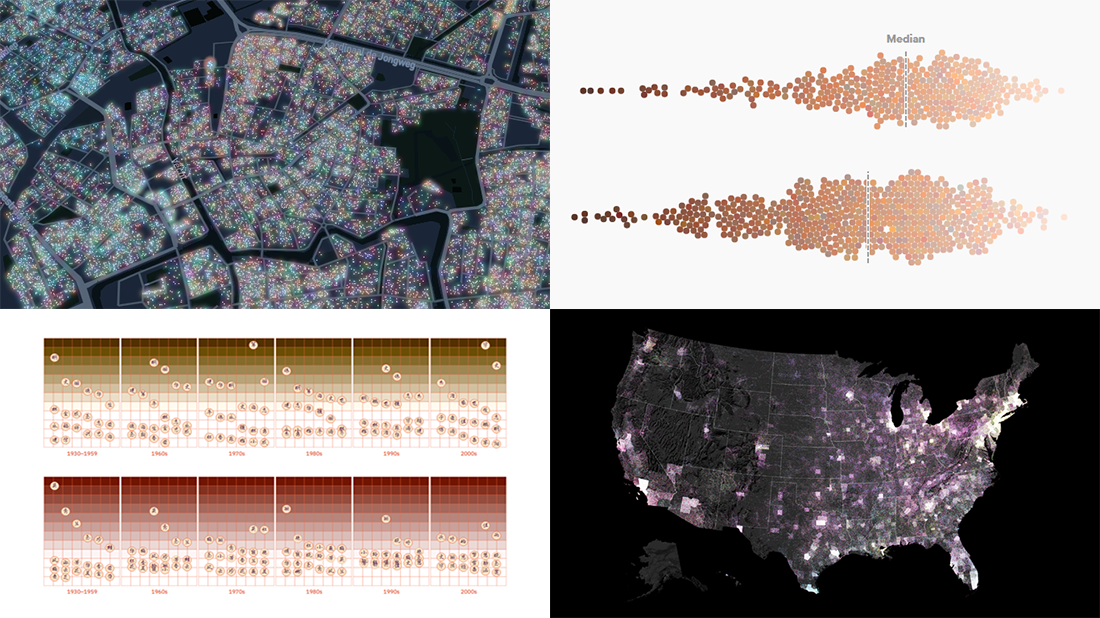 Every day, a number of new data visualizations on various topics come out around the internet. We are keen to curate the most awesome graphics and share them with you on DataViz Weekly! Today in the spotlight:
- Skin tones on the Instagram feeds of fashion and beauty brands — Quartz
- Timeline of the pandemic year — WaPo
- Evolution of Chinese names — Kontinentalist
- Dutch election results in detail — NRC
- Categories: Data Visualization Weekly
- 1 Comment »
Recognizing Most Interesting New Data Visualizations — DataViz Weekly
March 12th, 2021 by AnyChart Team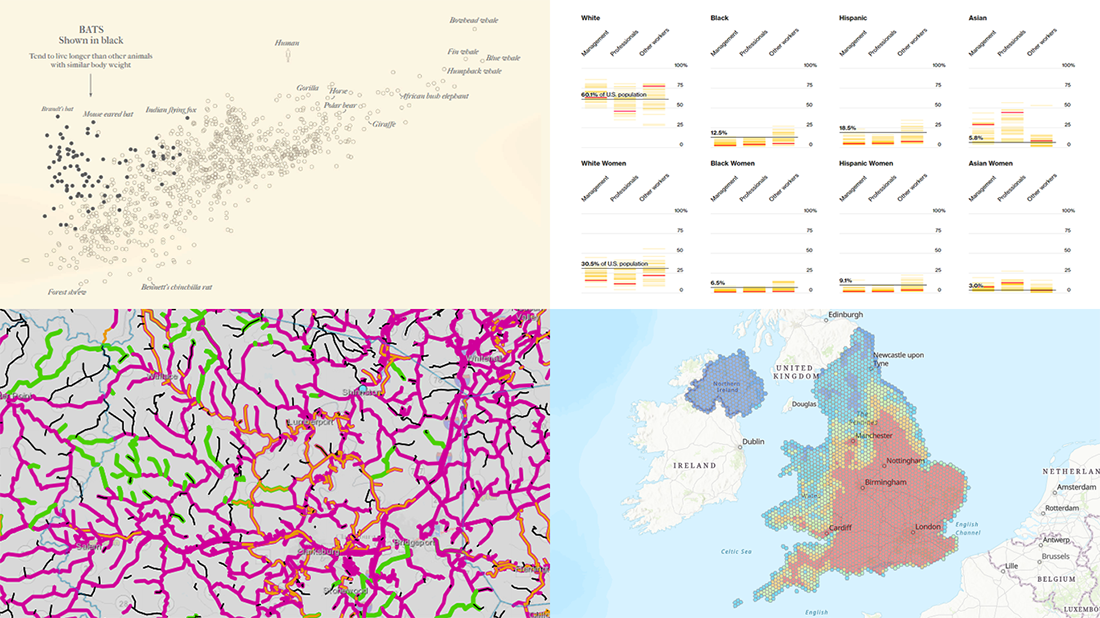 Welcome back to DataViz Weekly, our regular blog feature where we recognize some of the most interesting data visualizations we’ve recently seen out there. Here’s our new selection of stunning graphics from different people — take a look!
- Bats and the origin of virus disease outbreaks — Reuters
- Race and gender diversity within the biggest corporations in the U.S. — Bloomberg
- All roadwork projects in West Virginia for 2021 — WVDOT
- Climate threats to heritage sites in England, Wales, and Northern Ireland — National Trust
- Categories: Data Visualization Weekly
- No Comments »
Attacks on Press, COVID-19 Deaths, Infection Simulation, and U.S. Election — DataViz Weekly
February 26th, 2021 by AnyChart Team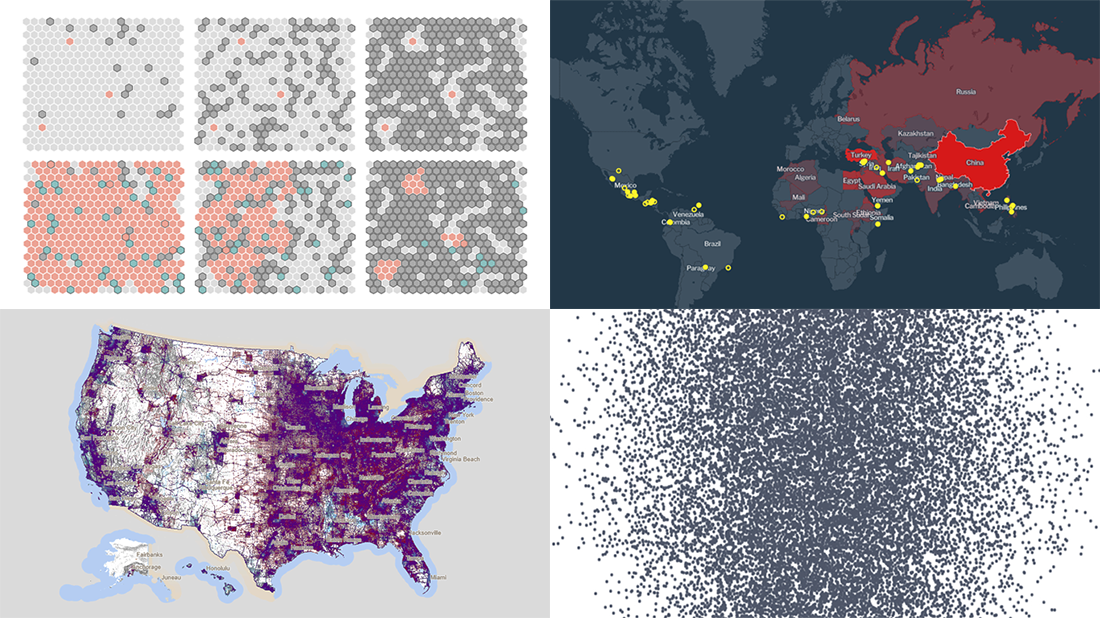 Hey everyone, Friday’s here and with it, a new DataViz Weekly article is out! Look at some of the best data visualization projects we have come across out there this week:
- Exploring all attacks on journalists worldwide in 2020 — Geoff McGhee for CPJ
- Visualizing the scale of 500,000 COVID-19 deaths in the United States — Sam Hart, Reuters
- Simulating the spread of infection for different immunity scenarios — Thomas Wilburn, NPR
- Mapping every vote in the 2020 U.S. election — Kenneth Field
- Categories: Data Visualization Weekly
- No Comments »
Visualizing Information on Coronavirus, MiLB Teams, and Providence Buildings — DataViz Weekly
February 19th, 2021 by AnyChart Team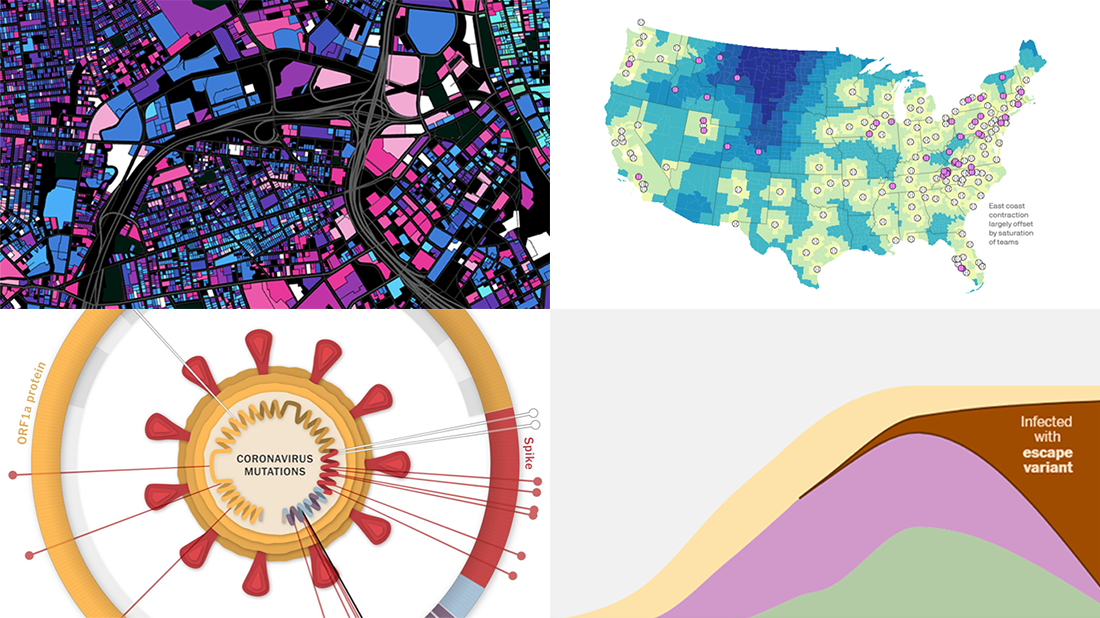 For us humans, data is usually easier to explore and analyze when it’s properly visualized. If you are looking for some good examples, you’ve come to the right place at the right time! DataViz Weekly is here to let you know about new great information visualizations.
Today on DataViz Weekly:
- Coronavirus vaccination pace, goals, and challenge — The Washington Post
- Coronavirus mutations and variants — The New York Times
- Distance to the nearest MiLB team in 2021 — Axios
- Age of buildings in Providence, RI — Chris Sarli
- Categories: Data Visualization Weekly
- 1 Comment »
Interesting Data Visualization Projects to Look at and Learn from — DataViz Weekly
February 12th, 2021 by AnyChart Team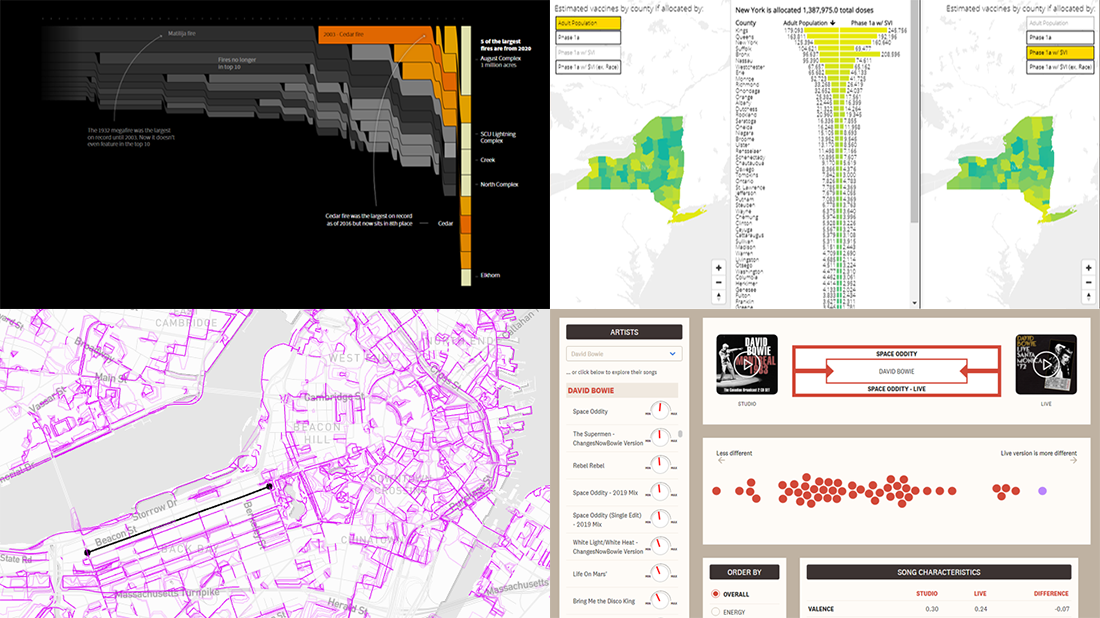 “Numbers have an important story to tell. They rely on you to give them a clear and convincing voice,” Stephen Few once said. That actually is the purpose of data visualization. On DataViz Weekly, we show you how this works in reality. Welcome to our new roundup of the most interesting data visualization projects we’ve recently found!
- Comparing live and studio versions of songs — The Pudding
- Historical wildfires in the U.S. West — Reuters
- Boston’s most desirable streets — MIT Senseable City Lab
- Inequality and COVID-19 vaccine allocation in America — GHJP Yale & C4SR Columbia
- Categories: Data Visualization Weekly
- No Comments »
New Stunning Charts and Maps from Around the Web — DataViz Weekly
January 29th, 2021 by AnyChart Team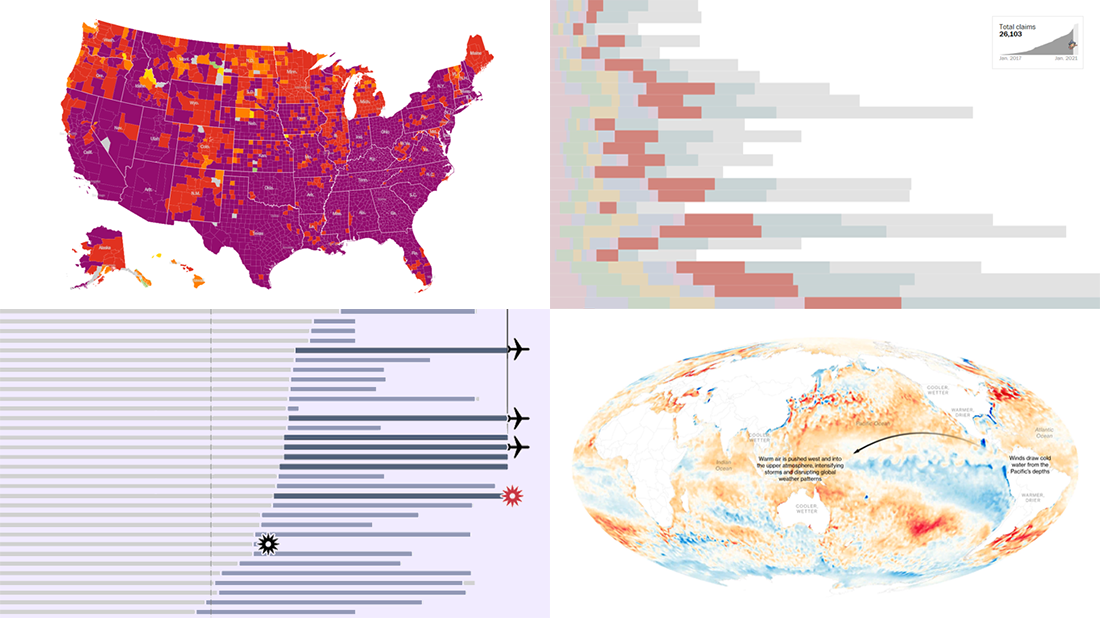 We continue our weekly blog feature where we show you the best data visualizations we’ve met out there over the past seven days. Here’s our new selection of stunning charts and maps from different creators — check it out! Today on DataViz Weekly:
- La Niña and its impacts — Bloomberg
- Donald Trump’s false and misleading claims while in office — The Washington Post
- COVID-19 risk levels by county — The New York Times
- Sriwijaya Air fleet — Reuters
- Categories: Data Visualization Weekly
- No Comments »
Latest Best Data Visualizations Worth Checking Out — DataViz Weekly
December 25th, 2020 by AnyChart Team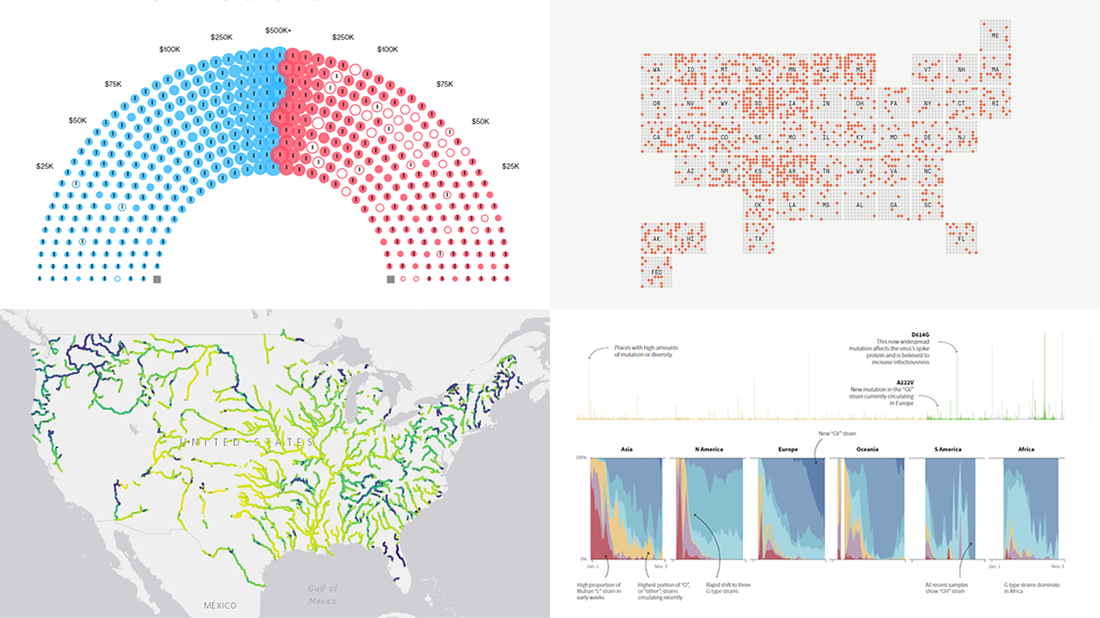 Merry Christmas everyone (who’s celebrating)! ? Meanwhile: COVID, election, and environment — the topics quite symbolic for this year are in the spotlight of today’s, the year’s last DataViz Weekly. Don’t miss out on some of the latest best data visualizations!
Look at the list of projects featured on DataViz Weekly this time and keep reading to learn more about each:
- Winners of the 2020 U.S. election by funding from Wall Street — Bloomberg
- COVID-19 infection rates in prisons by state — The Marshall Project
- Novel coronavirus strains in evolution worldwide — Reuters
- River colors across the United States — Gardner Hydrology Lab at Pitt
- Categories: Data Visualization Weekly
- 1 Comment »
New Graphics That Make Data Talk — DataViz Weekly
December 18th, 2020 by AnyChart Team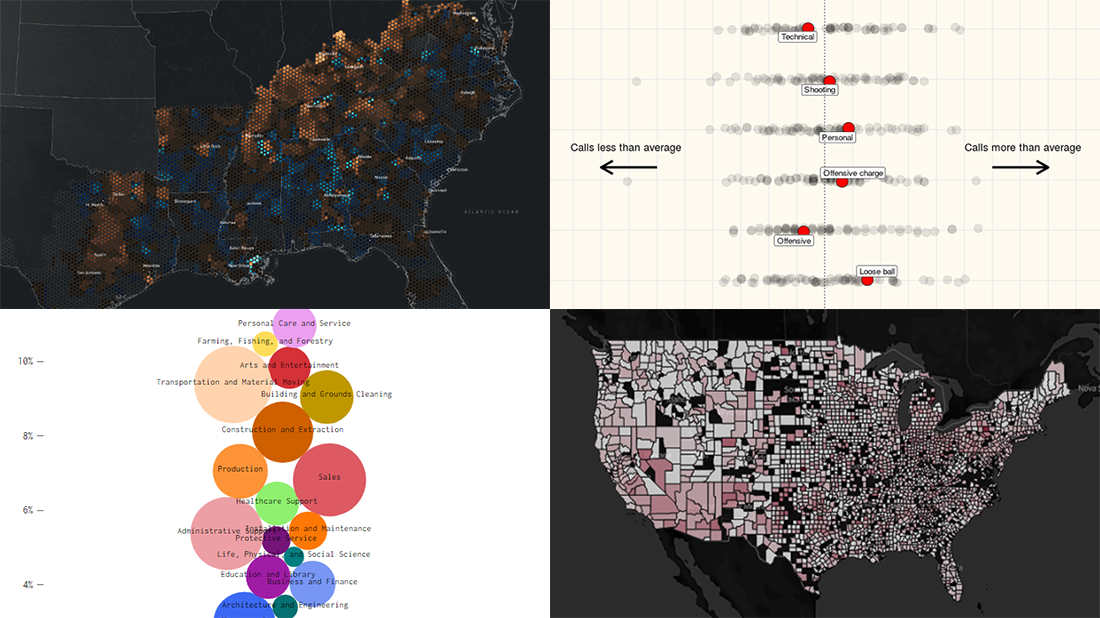 Get ready for another dose of amazing charts and maps! DataViz Weekly‘s here to show you a set of new projects featuring graphics that make data talk — excellent examples of data visualization in action!
Here are this week’s picks:
- Over 200 years of migrations in the American South — Edward Ayers, Nathaniel Ayers & Justin Madron
- NBA fouls and violations, by referee — Owen Phillips
- U.S. unemployment change, by occupation — Nathan Yau
- U.S. hospital COVID-19 bed occupancy — Carlson School of Management at UMN
- Categories: Data Visualization Weekly
- No Comments »