 Hey everyone, Friday’s here and with it, a new DataViz Weekly article is out! Look at some of the best data visualization projects we have come across out there this week:
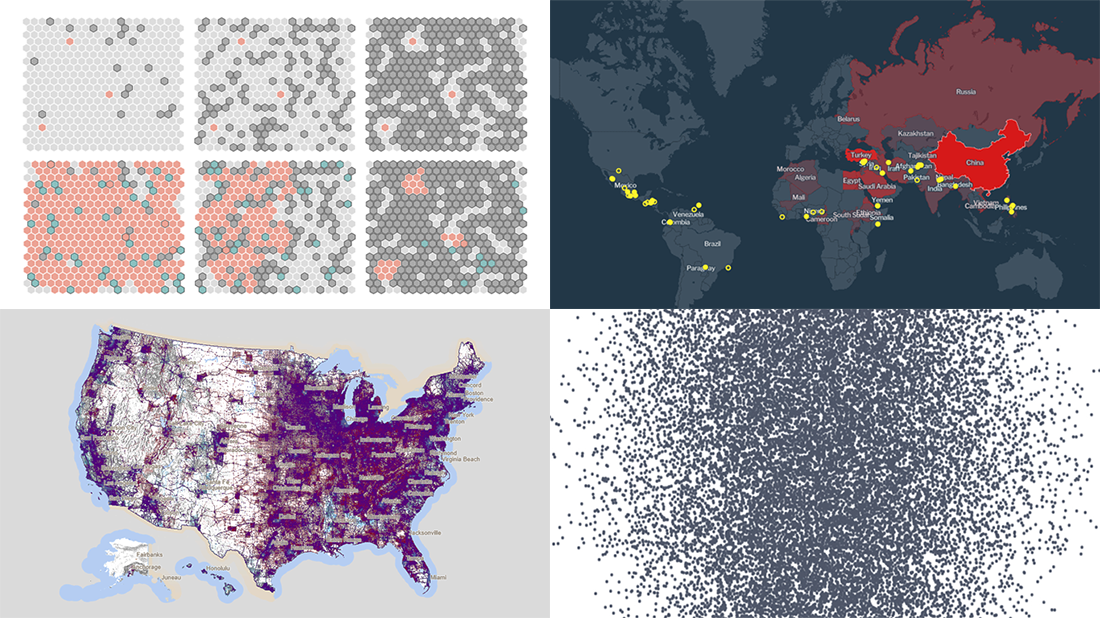
- Exploring all attacks on journalists worldwide in 2020 — Geoff McGhee for CPJ
- Visualizing the scale of 500,000 COVID-19 deaths in the United States — Sam Hart, Reuters
- Simulating the spread of infection for different immunity scenarios — Thomas Wilburn, NPR
- Mapping every vote in the 2020 U.S. election — Kenneth Field
Data Visualization Weekly: February 19, 2021 — February 26, 2021
Attacks on Journalists Worldwide in 2020
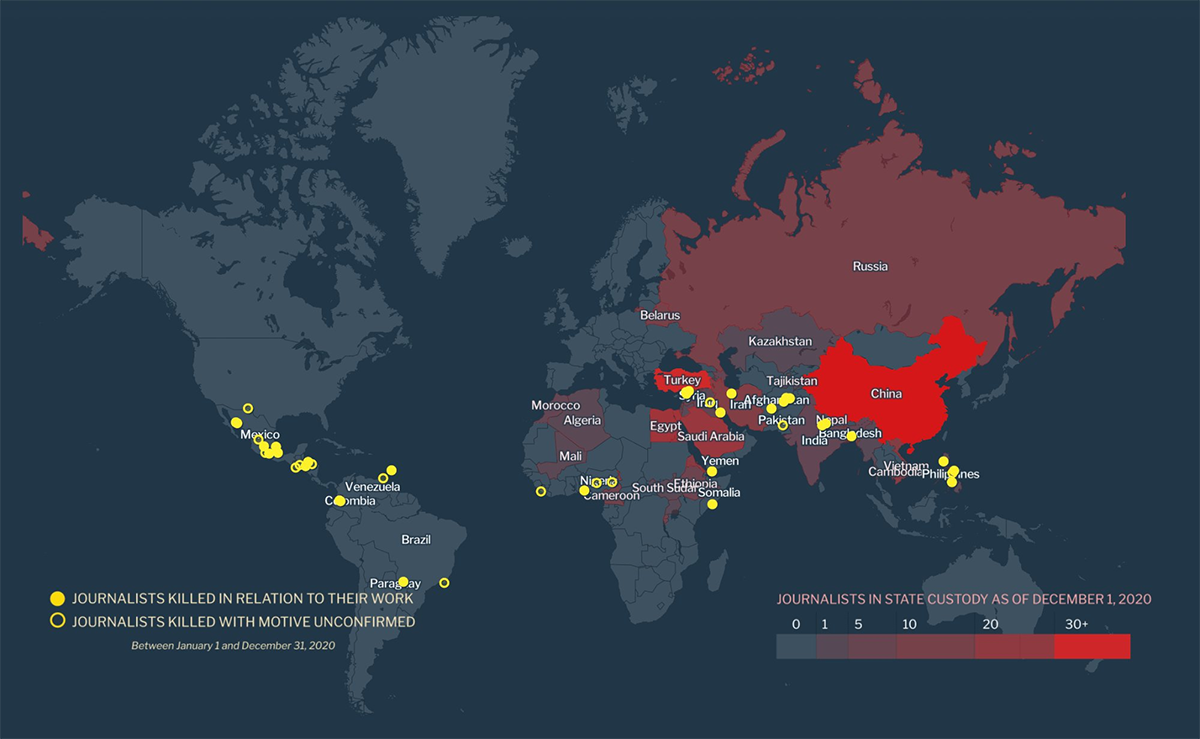
The year 2020 was record-breaking in multiple aspects. The scale of attacks on the press is one of them. According to data from a new report of the Committee to Protect Journalists (CPJ), a record number of journalists all over the world were imprisoned last year. At the same time, twice more were killed in reprisal for their professional activity than in 2019.
Now you can take a closer look at the trends using a new interactive map just published on the CPJ website. Built by Geoff McGhee, a known expert in visual journalism and storytelling, it represents countries based on the number of journalists in jail in 2020. The map also shows where journalists were murdered in relation to their work and with the motive yet to be confirmed, during the last year.
To start with, let a scroll-driven story walk you through CPJ’s data. Then, feel free to explore the map itself. Hover over and click on the data points for details including the victims’ stories.
Scale of 500,000 COVID-19 Deaths in America
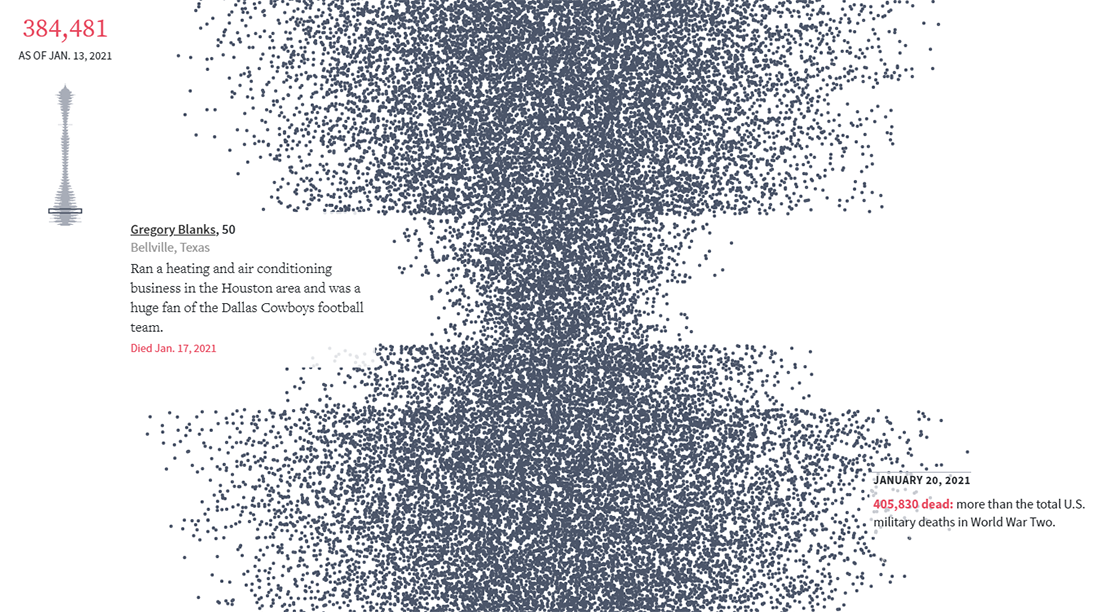
On Monday, the United States passed the horrifying milestone of 500,000 reported deaths from COVID-19. Numbers so large are usually hard to imagine and properly understand. That’s where visualizations can be helpful, you know.
Sam Hart from the Reuters Graphics team created an impressive scrollytelling timeline that represents the true scale of the coronavirus death toll in America. One dot here marks one casualty. It all starts with one, the first COVID-19 death as of February 6, 2020. As you scroll, you see more and more dots. They were real people. The counter is merciless…
This is another good example of scrollytelling in action to help make sense of such information. A smaller version of the graphic on your left lets you track where you are. Feel the scale of the 500,000 lives lost.
Infection Spread for Different Immunity Scenarios
In the meantime, we keep losing people as the pandemic persists. So, what is it really going to take to stop it?
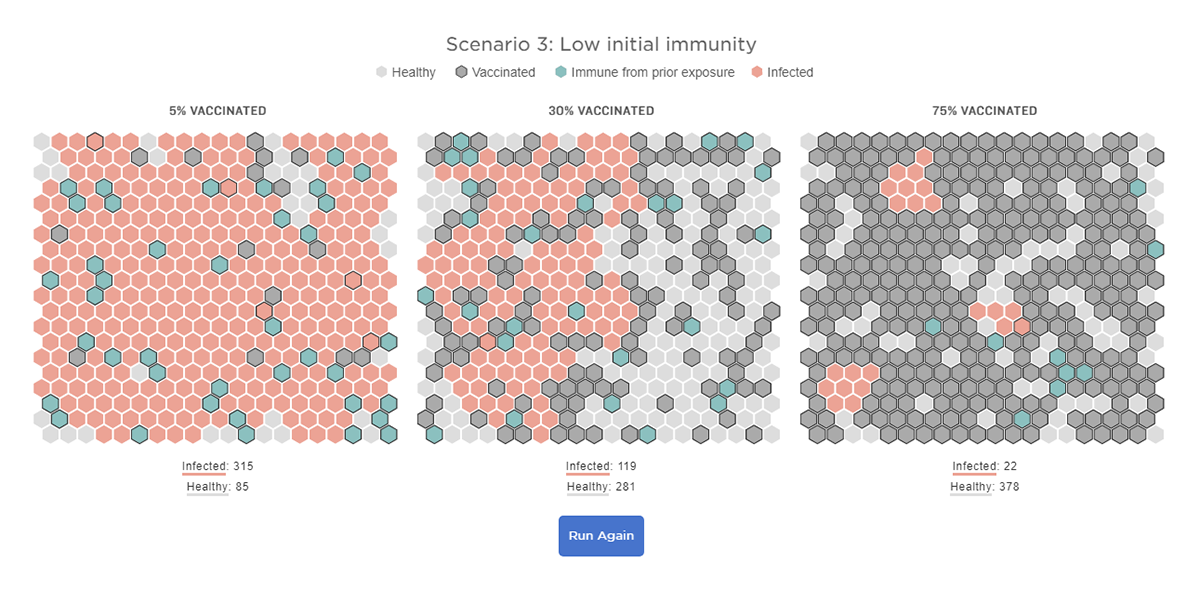
Last week, we looked at new graphics from The Washington Post showing the importance of rapid vaccination on the way toward herd immunity. New NPR’s simulations also make it evident. Thomas Wilburn employed hexagons to visualize three scenarios of how an infection like this could spread and how quickly herd immunity could be achieved in a community depending on certain circumstances.
The first scenario simulation demonstrates what if a more infectious variant becomes dominant. The second one assumes there already is high preexisting immunity from earlier exposure. Finally, a situation with lower immunity levels in a population is analyzed. In all three scenarios, there are three vaccination rate settings: 5% vaccinated, 30% vaccinated, and 75% vaccinated.
So, here are more great simulations showing how herd immunity works and what is in its way.
Every Vote in 2020 U.S. Election, in Dot Density Map
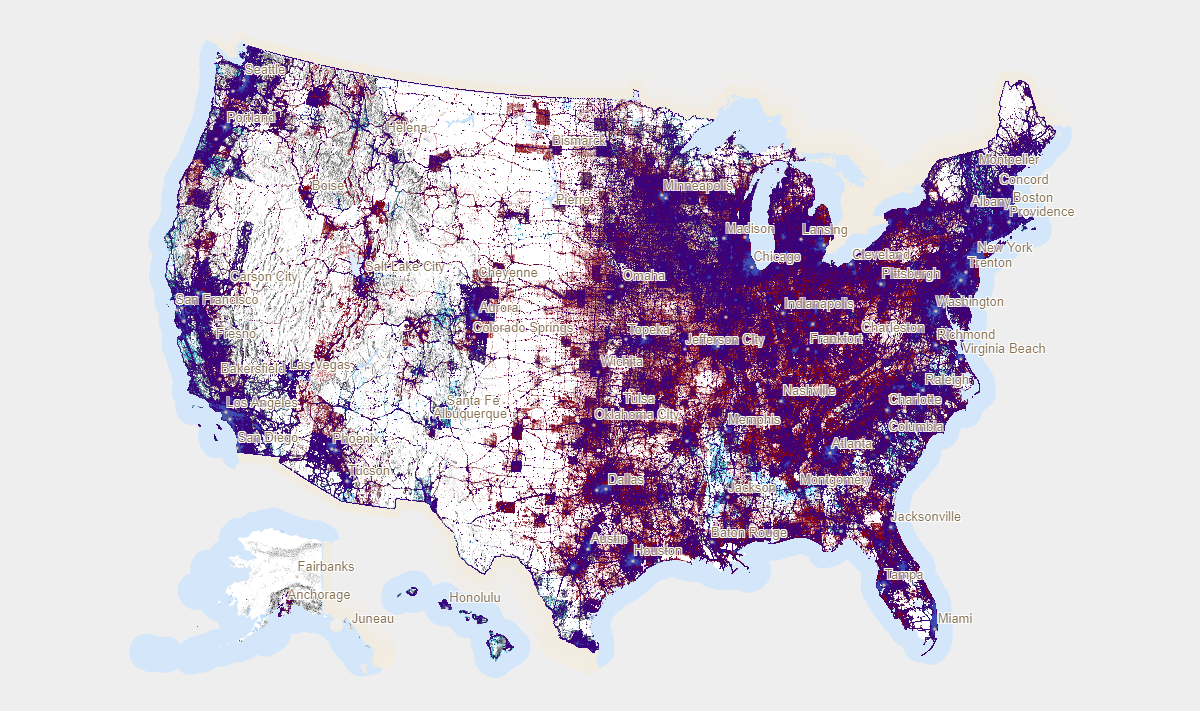
Last but not least for today: Kenneth Field made an amazingly detailed map of the 2020 U.S. Presidential election results, showing every single vote as one dot. As you might expect, the color of dots represents whether that vote was Democratic (blue), Republican (red), or different (orange).
Overall, there are 74,216,154 red points, 81,268,924 blue points, as well as 2,898,325 orange points, totaling 158,383,403 points. It’s interesting to observe how different colors get mixed into something purple in highly populated areas. Zoom in for a more detailed view. Click to see the results in the corresponding county.
Wondering how this dot density map was built? Check out Kenneth’s explanations in two parts, 1 and 2.
***
Stay tuned for great data visualization examples from around the web, in our weekly roundups that are out on Fridays!
- Categories: Data Visualization Weekly
- No Comments »