Cool Charts on Housing, Climate, Jobs, and Economy — DataViz Weekly
December 13th, 2019 by AnyChart Team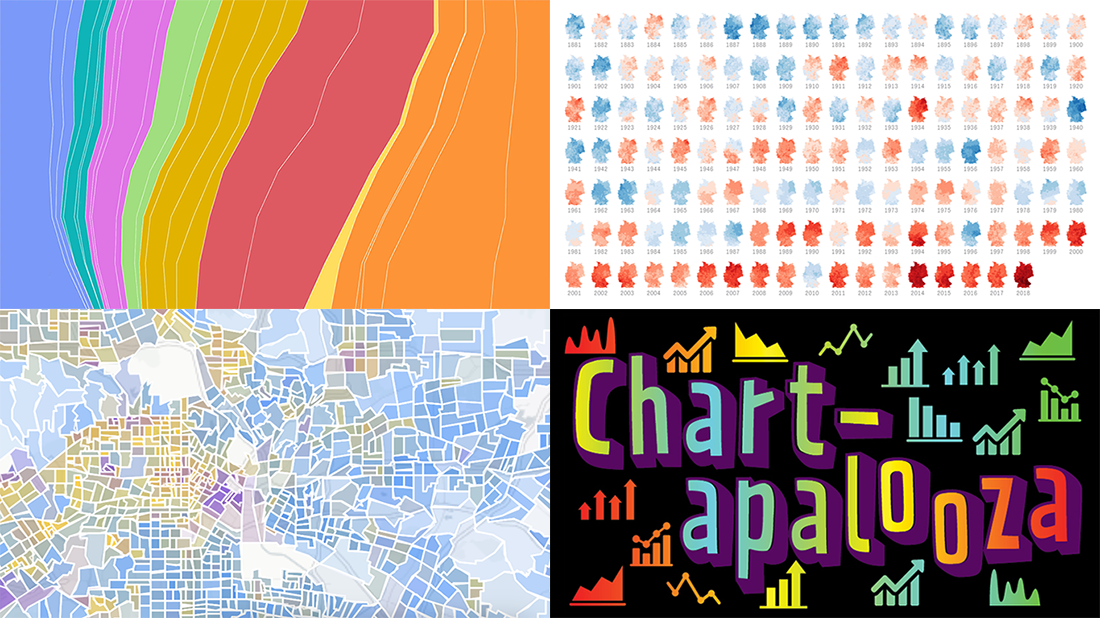 We know you love good data visualizations. So what we have here for you today is a presentation of new cool charts we’ve found this week. Look at the fresh examples of awesome data graphics, in DataViz Weekly:
- U.S. metropolitan growth — Zillow
- Climate change in Germany — Zeit Online
- Changes in job distribution in America — FlowingData
- Canada’s economy chartapalooza — Maclean’s Magazine
- Categories: Data Visualization Weekly
- No Comments »
Information Graphics About Friends, Birds, Savings, and Pollution — DataViz Weekly
November 1st, 2019 by AnyChart Team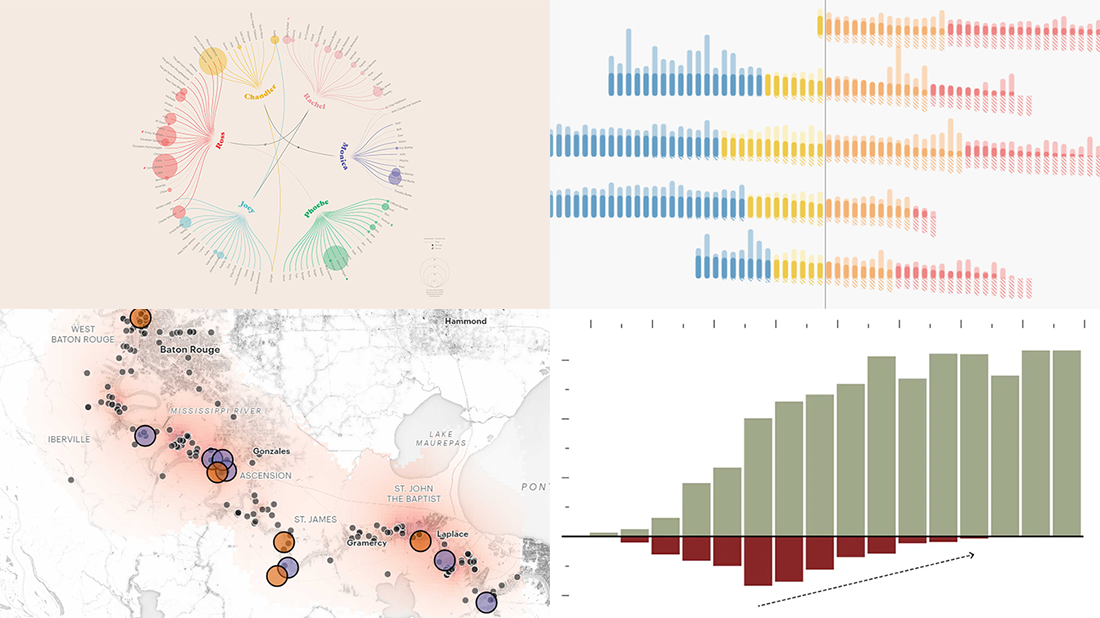 Take a look at four cool information graphics projects we’ve recently come across around the web and decided to feature this time in the DataViz Weekly series:
- Travels, events, and relationships in the Friends TV series — Marion Rouayroux, IIB Awards
- North American birds at risk from climate change — Audubon
- Assets and debt in the United States by age group — FlowingData
- Aggravating air pollution in Louisiana’s “Cancer Alley” — ProPublica
- Categories: Data Visualization Weekly
- 3 Comments »
Compelling Data Visualizations to Check Out This Weekend — DataViz Weekly
October 25th, 2019 by AnyChart Team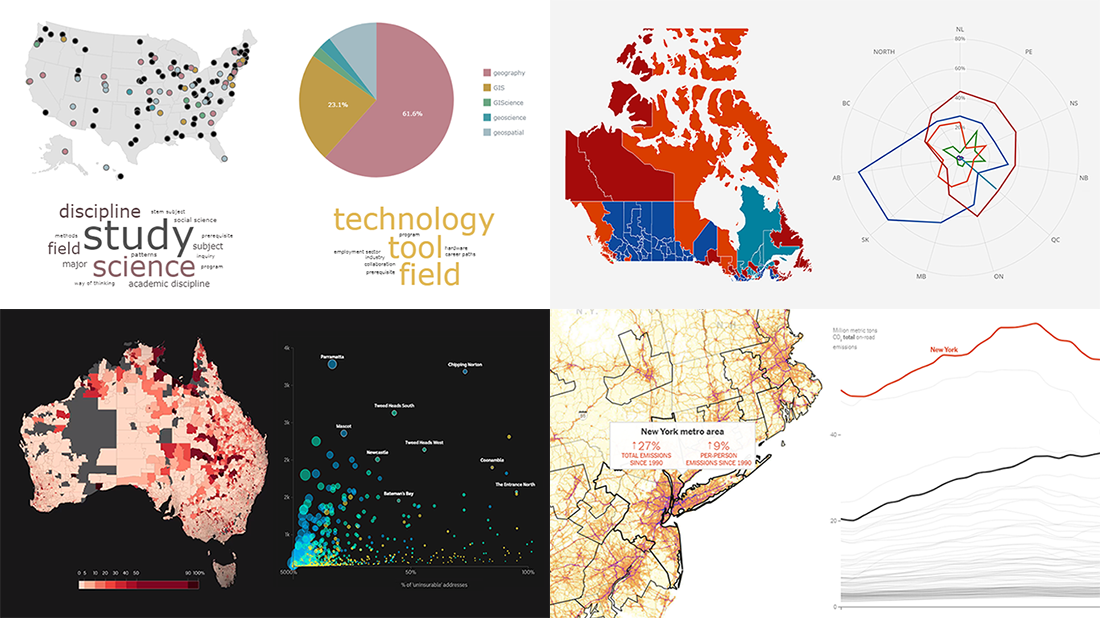 Continuing our regular DataViz Weekly feature, we invite you to check out several compelling data visualizations worth taking a look at, which we’ve noticed and enthusiastically explored these days. Here’s a quick list of the projects highlighted in the new roundup:
- Impact of climate change on the costs and availability of insurance in Australia — ABC News
- “Geography” and “GIS” in the U.S. higher education — Alicia Bradshaw, UW Tacoma
- Auto emissions in America — The New York Times
- Canadian federal election results — CBC/Radio-Canada
- Categories: Data Visualization Weekly
- No Comments »
Visual Data Projects About National Parks, Drug Crime, Political Identity, and Top Websites — DataViz Weekly
August 16th, 2019 by AnyChart Team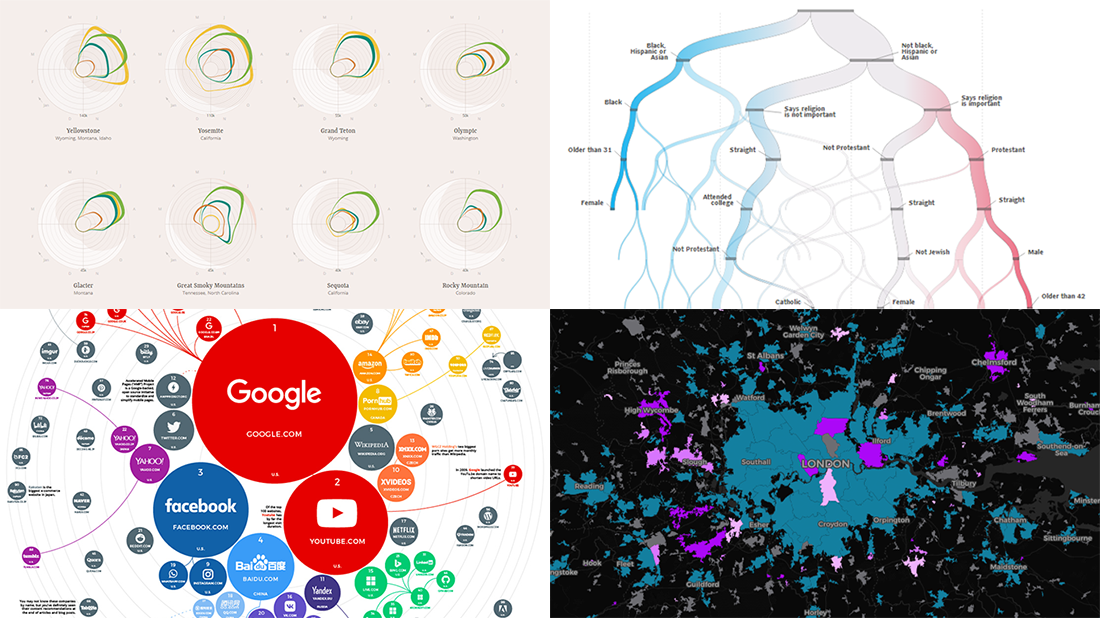 Check out some of the new exciting visual data projects that we’ve recently found around the web. Here’s a quick list of what’s featured today on DataViz Weekly:
- Discovering the best time to visit a national park in the United States
- Revealing drug crime trends in England and Wales
- Analyzing demographics to predict a preferred political party
- Ranking the top 100 websites
- Categories: Data Visualization Weekly
- No Comments »
Visual Analytics Examples for City Climate, Pain Pills, Water Fountains, and Space Travels — DataViz Weekly
July 19th, 2019 by AnyChart Team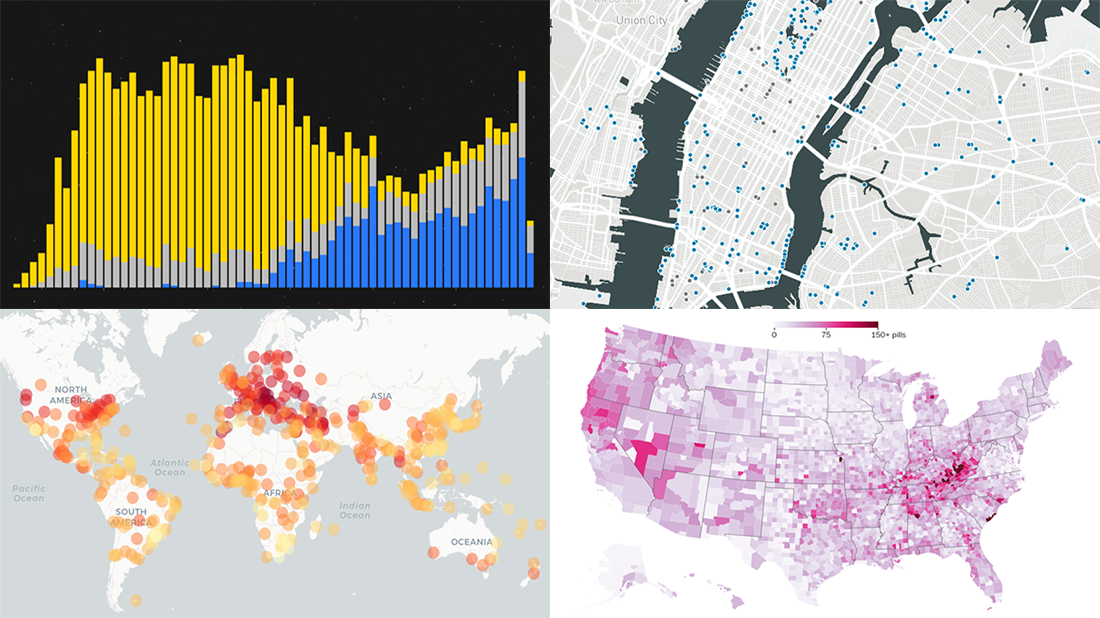 Enjoy another selection of new cool data visualization projects as great examples of visual analytics in action. Here’s what questions the charts featured today on DataViz Weekly show answers to:
- What city’s current climate will your city’s climate resemble in 2050? — Crowther Lab
- How legal pain pills were distributed across the United States in 2006-2012? — The Washington Post
- Where is the nearest water fountain? — Matthew Moy de Vitry
- How space travel has developed since Sputnik in 1957? — Reuters
- Categories: Data Visualization Weekly
- No Comments »
Data Analytics and Visualization Examples Worth Seeing: High Street, Neighborhoods, Trains, Climate — DataViz Weekly
February 8th, 2019 by AnyChart Team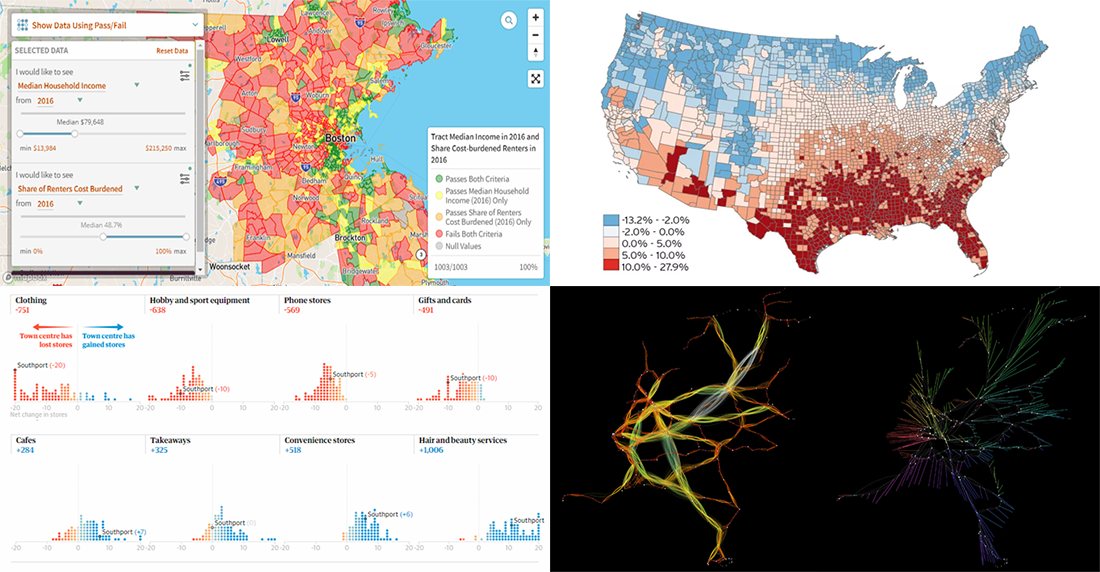 Check out new interesting data analytics and visualization examples from around the web. Here are the topics in the focus of today’s DataViz Weekly:
- high-street crisis in town centers across England and Wales;
- interactive maps of changes in Greater Boston’s neighborhoods;
- connectivity between train stations in the Netherlands;
- economic costs of climate change vs election results in the United States.
- Categories: Data Visualization Weekly
- No Comments »
New Cool Data Visualizations on Emissions, Climate, Travel, and Music — DataViz Weekly
December 7th, 2018 by AnyChart Team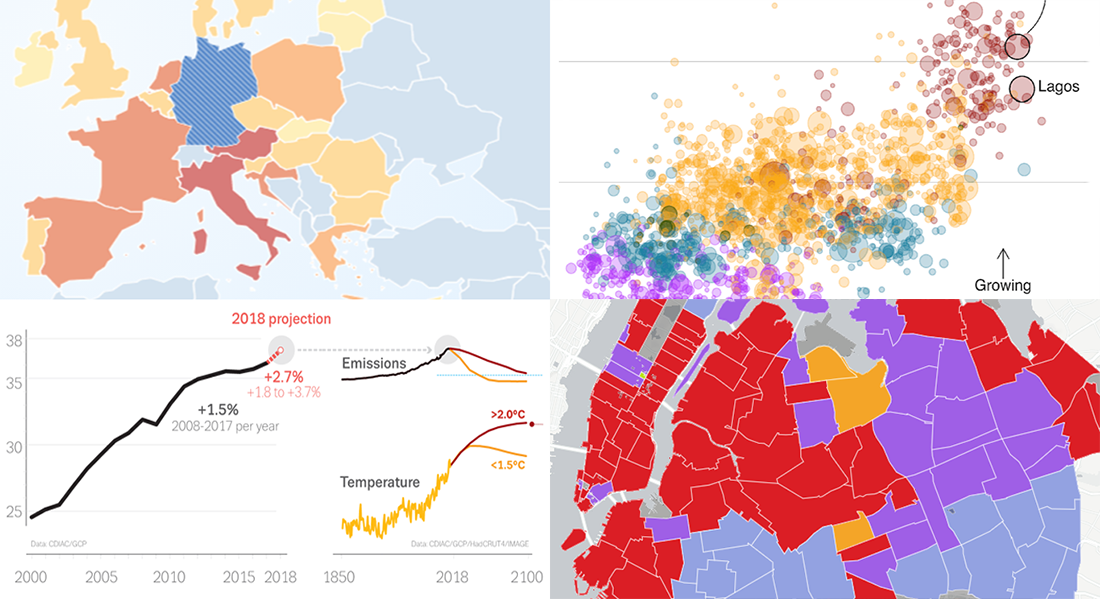 Take a look at new cool data visualizations recently published on the web. In today’s DataViz Weekly, we are glad to feature interesting information graphics from the Global Carbon Project, BBC News, Berliner Morgenpost, and Vivid Seats, dedicated to the following subjects:
- carbon dioxide emissions;
- current state of climate change;
- top 2018 summer travel destinations for Germans;
- top music genres and artists in NYC by neighborhood.
- Categories: Data Visualization Weekly
- No Comments »
Interesting Data Visualization Projects About Thanksgiving, Air, Greenery, and Rape Clearance — DataViz Weekly
November 23rd, 2018 by AnyChart Team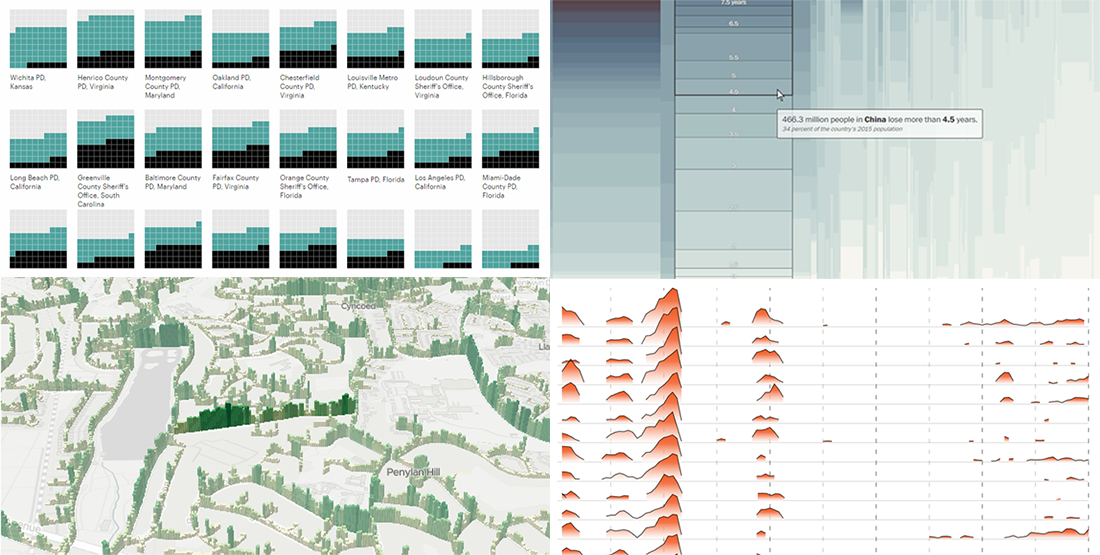 Happy Thanksgiving holiday! While the traditional Black Friday rush is getting into the full swing, we hope you can spare a minute to check out new interesting data visualization projects. Let’s see a list of what’s featured this time on DataViz Weekly and without more ado proceed to the charts:
- years lost due to air pollution;
- urban greenery in Cardiff and Newport;
- rape case clearance rates across the United States;
- Thanksgiving holiday trends.
- Categories: Data Visualization Weekly
- No Comments »
New Data Visualizations About Swedish Election, U.S. Cropland, Hurricanes, and Night Lights — DataViz Weekly
September 14th, 2018 by AnyChart Team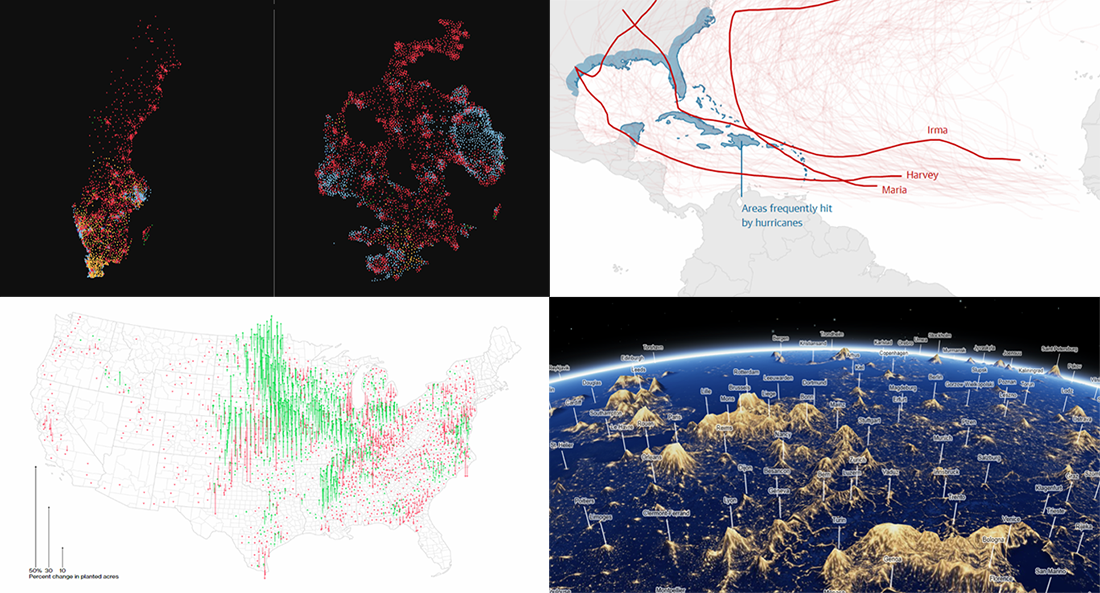 Yay, it’s DataViz Weekly time again! Here’s what new data visualizations we’ve recently found around the web and decided to share with you now:
- Swedish general election results;
- American cropland’s shift away from diversity;
- climate change and hurricanes;
- world cities’ night lights visualized as terrain.
- Categories: Data Visualization Weekly
- No Comments »
Data Visualization Projects About Construction, PMI Activity, Climate, and Election — DataViz Weekly
August 24th, 2018 by AnyChart Team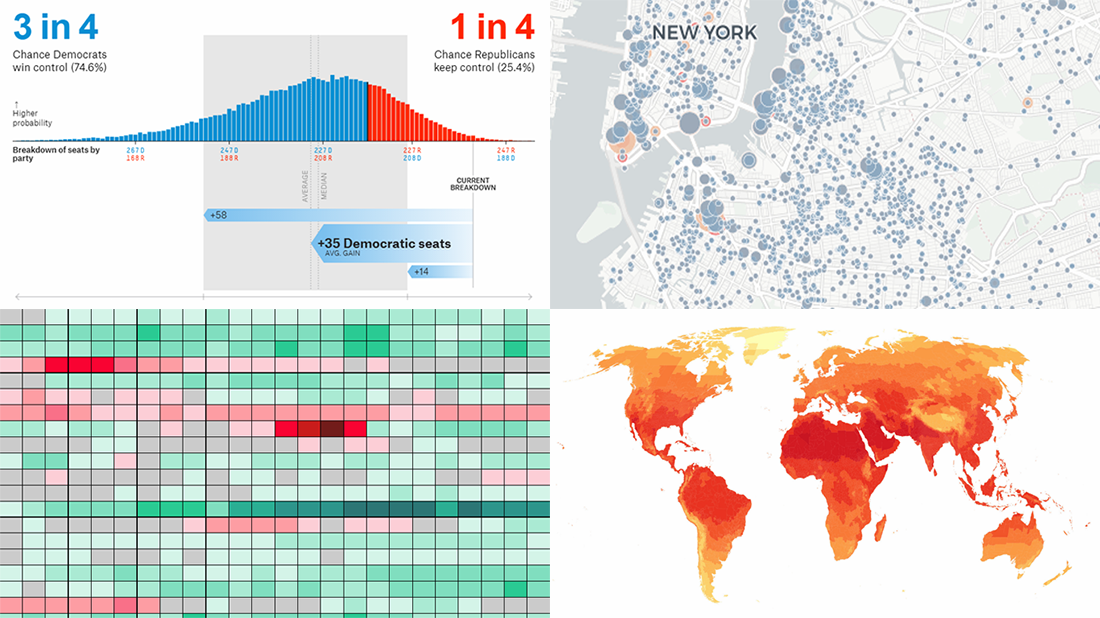 Welcome to DataViz Weekly, a regular feature on the AnyChart blog that highlights some of the most interesting new data visualization projects each Friday.
Here’s what we are glad to tell you about this time:
- active constructions in New York City, in real time;
- global PMI activity;
- cities with no need for air conditioning and heating;
- 2018 U.S. House midterm election forecast.
- Categories: Data Visualization Weekly
- No Comments »