Great New Data Visualizations Worth Your Attention — DataViz Weekly
July 15th, 2022 by AnyChart Team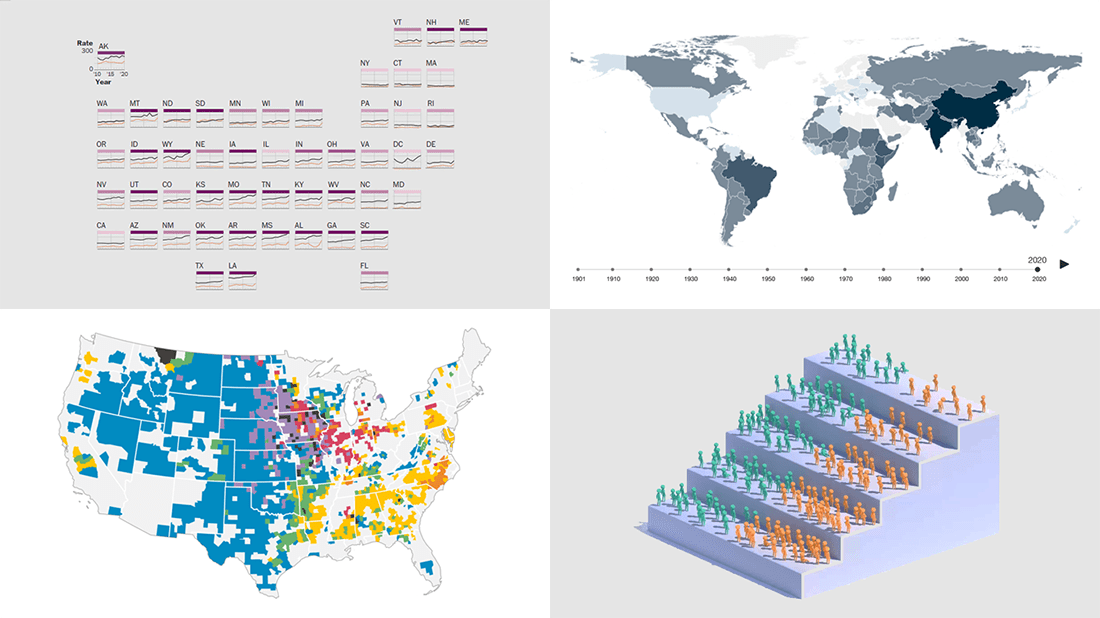 Eager to see some great data visualizations? Your wait is over! DataViz Weekly is back to the AnyChart blog to make sure you have not missed these four new works as they are definitely worth checking out!
- Gun deaths in America — The Washington Post
- Health effects of climate change worldwide — Wellcome
- Economic success of the U.S. immigrants’ children — The New York Times Opinion
- Livestock vs human populations in the United States — Data Stuff
- Categories: Data Visualization Weekly
- No Comments »
Effective Visualizations of Information on Pandemic, Climate, Happiness, Travel Time — DataViz Weekly
July 30th, 2021 by AnyChart Team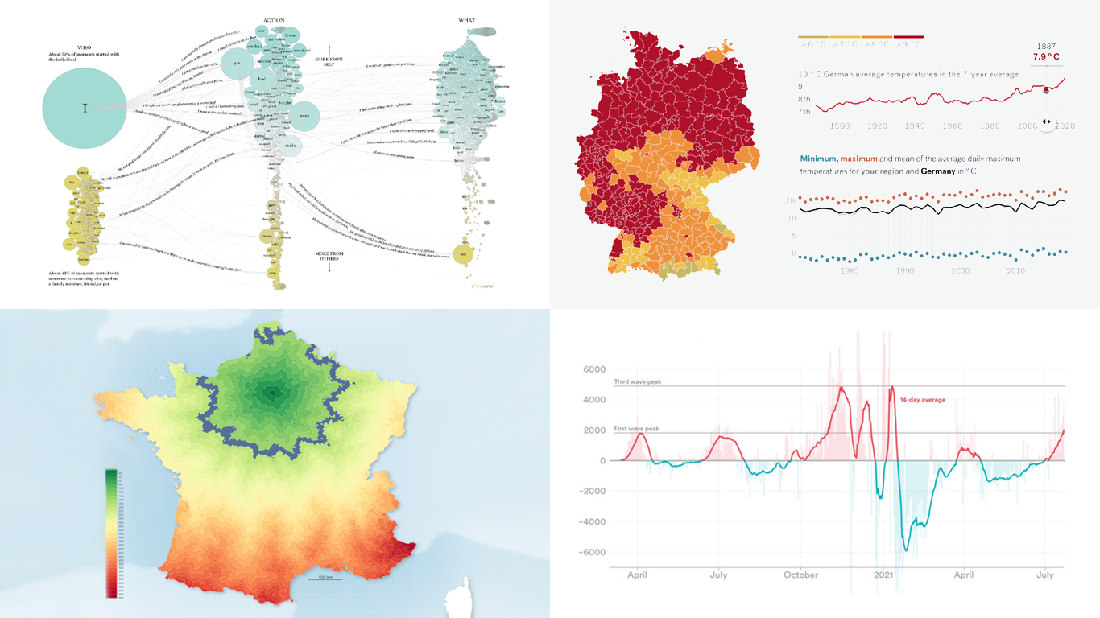 Data becomes easier to perceive and draw insights from when it is properly represented in charts and maps. For everyone interested to check out how information visualization works, we continue our regular feature DataViz Weekly curating the best new examples of effective graphics. Here are our latest picks:
- COVID-19 case acceleration rates — STAT
- Climate change risks across Germany — Vislab
- What makes people happy the most — Nathan Yau
- Driving time to Paris from across France — Nicolas Lambert
- Categories: Data Visualization Weekly
- No Comments »
Discover Some of Most Interesting Recent Data Visualization Projects — DataViz Weekly
July 23rd, 2021 by AnyChart Team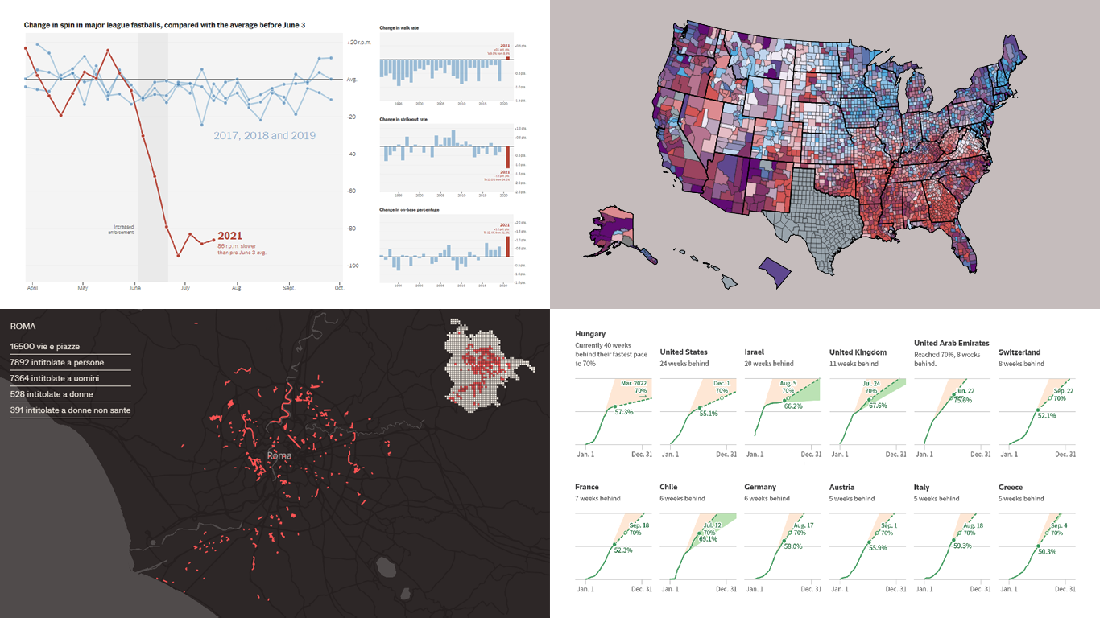 Look at some of the most interesting data visualizations we have come across out there over the last few days! The following projects are deservedly featured in DataViz Weekly this time:
- Falling spin rates in American baseball after a crackdown on sticky substances — The Upshot
- Gender diversity in Italian street names — EDJNet
- Shifts in the COVID-19 vaccination pace worldwide since January 2021 — Reuters
- Vaccination equity in America — CDC
- Categories: Data Visualization Weekly
- No Comments »
How to Build Pareto Chart in JavaScript
February 16th, 2021 by Dilhani Withanage Creating a Pareto chart with JavaScript for HTML5 apps and websites is not a complicated or hectic development process at all. Get hands-on experience with this tutorial and you will find data visualization in such a form joyful and exciting!
Before we start, let’s remember how Pareto charts look and what their purpose is, just to make sure we are on the same page. A Pareto chart, also a Pareto diagram, is a combination of vertical bars (columns) and a line graph. Columns are used to depict values and are displayed in descending order, left to right. The line in a Pareto chart shows the cumulative total in percentages. Such a visualization helps data scientists and analysts quickly identify the most important among a set of factors, i.e. those characterized by the largest values and therefore making the most significant contribution to the total across all the represented factors.
In this JS Pareto chart tutorial, we’ll be visualizing statistics for the leading causes of death in the United States in 2019 and find out what claimed the most American lives during that year according to official data.
Now let’s move to JavaScript charting, and more precisely, building an interactive Pareto chart using JS!
Read the JS charting tutorial »
- Categories: AnyChart Charting Component, Big Data, HTML5, JavaScript, JavaScript Chart Tutorials, Tips and Tricks
- No Comments »
Information Visualization Techniques in Action on Democracy, Covid-19, Inequality & Gerrymandering — DataViz Weekly
June 26th, 2020 by AnyChart Team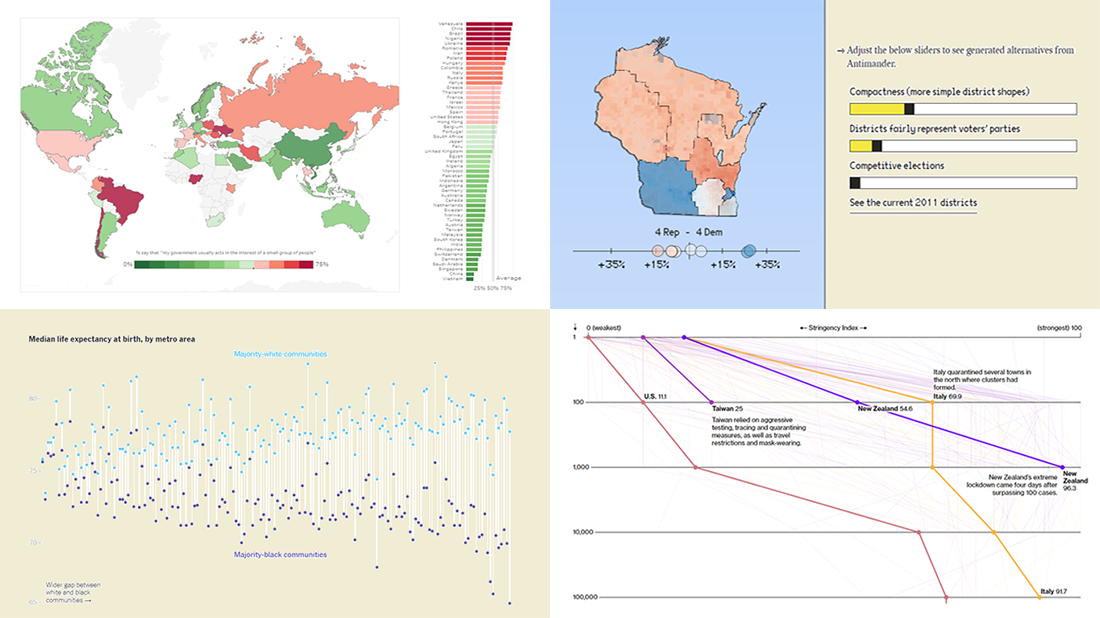 DataViz Weekly is here exhibiting new interesting projects from around the web that demonstrate a great use of different information visualization techniques to deliver better insight. See our new picks:
- Democracy Perception Index 2020 — Dalia
- Government reactions to the Covid-19 pandemic — Bloomberg News
- Gaps between Black and White America — The New York Times Opinion
- Antimander, a tool to expose gerrymandering in congressional districts — Joel Simon
- Categories: Data Visualization Weekly
- No Comments »
StopCorona Creator Shares How They Visualize COVID-19 Data Using AnyChart
May 21st, 2020 by AnyChart Team![]() Earlier, we introduced you to a new, ever-updating COVID tracker that uses AnyChart to visualize the latest pandemic data in insightful charts, StopCorona.info. To let you know more, we also talked to Vadim Peskov, CEO at Diffco, the app development company behind StopCorona, and asked him a few questions.
Earlier, we introduced you to a new, ever-updating COVID tracker that uses AnyChart to visualize the latest pandemic data in insightful charts, StopCorona.info. To let you know more, we also talked to Vadim Peskov, CEO at Diffco, the app development company behind StopCorona, and asked him a few questions.
Read our quick interview to learn more about StopCorona and their experience using our JavaScript charting library for interactive data visualization. (Stack: MySQL/Symfony/Angular.)
- Categories: AnyChart Charting Component, Big Data, Charts and Art, HTML5, JavaScript, Success Stories
- 3 Comments »
Hot Visualizations on Youth Life, American Names, Climate Change, and Mother Tongues — DataViz Weekly
January 24th, 2020 by AnyChart Team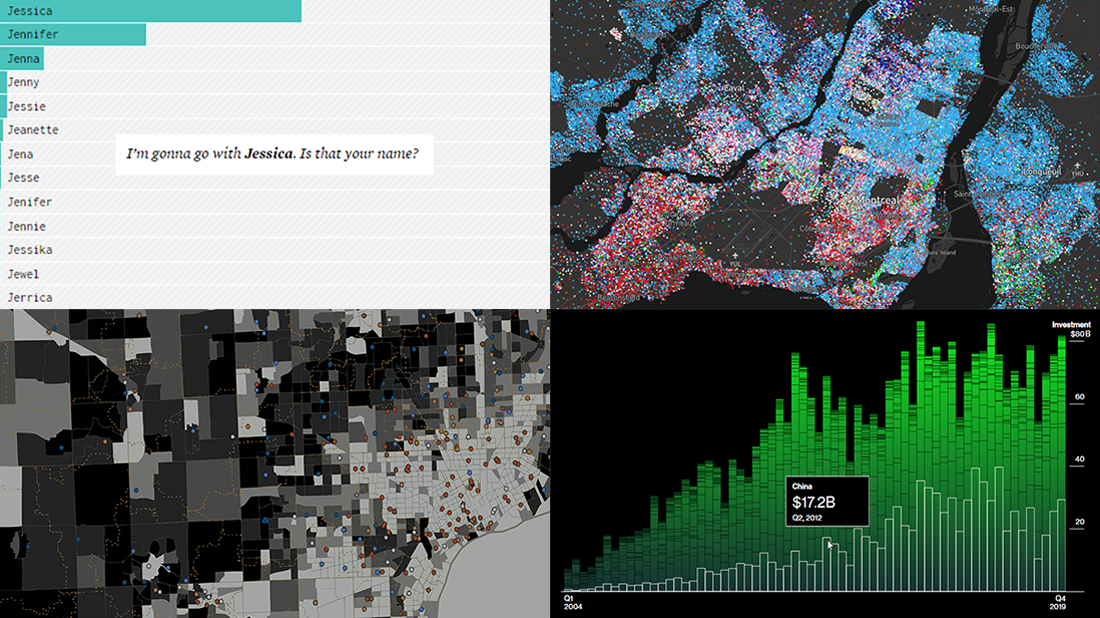 Check out some of the new hot visualizations we have come across this week! Not only are they good graphical data presentation examples, they also bring interesting insights.
- Youth life expectancy and educational opportunity across the United States — Child Trends
- Guessing names based on what letter(s) they start with — FlowingData
- Climate change scoreboard — Bloomberg Green
- Mother tongues across Canada — Anagraph
- Categories: Data Visualization Weekly
- No Comments »