![]() Earlier, we introduced you to a new, ever-updating COVID tracker that uses AnyChart to visualize the latest pandemic data in insightful charts, StopCorona.info. To let you know more, we also talked to Vadim Peskov, CEO at Diffco, the app development company behind StopCorona, and asked him a few questions.
Earlier, we introduced you to a new, ever-updating COVID tracker that uses AnyChart to visualize the latest pandemic data in insightful charts, StopCorona.info. To let you know more, we also talked to Vadim Peskov, CEO at Diffco, the app development company behind StopCorona, and asked him a few questions.
Read our quick interview to learn more about StopCorona and their experience using our JavaScript charting library for interactive data visualization. (Stack: MySQL/Symfony/Angular.)
AnyChart: To begin with, please tell our community about yourself. What do you guys do?
Vadim Peskov: Diffco team develops robust mobile apps powered by AI and secure architecture. Based in Sunnyvale, CA, we work on local and international markets. We also develop our own products and technologies in the computer vision field which helps to bring advanced computer vision features into our clients’ apps and web services.
A: How did the idea of StopCorona first come? Why did you decide to make this COVID tracking project?
VP: The idea came up naturally, as COVID-19 outbreak has affected every single person in our world. In the first phases of the pandemic development, people were struggling with the absence of clear information in a representable way, hence we have decided to utilize our resources to create a ubiquitous tool for the outbreak monitoring and statistical analysis.
We started that as a product for ourselves, our friends, and community but then while the COVID-19 trend continued to grow, we realized that more people in the world need such a valuable source of information.
A: So what is StopCorona now, in reality? Is it exactly what you wanted to create?
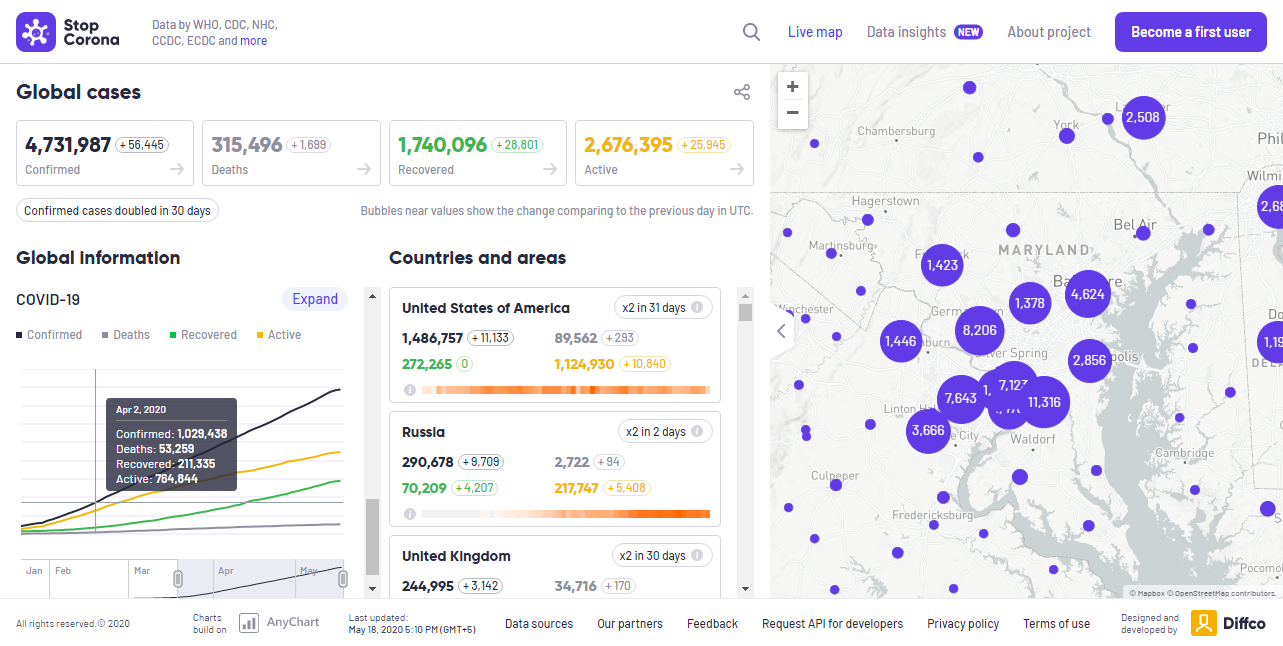
VP: StopCorona now is a powerful web application with a versatile set of analytical insights of COVID-19 outbreak, which is supported with clear and minimalistic visualizations.
We also did a lot of work aggregating various official data sources and processing that in live mode to provide the most actual and proofed data. That was the most challenging part as COVID-19 statistical data posted on official data sources is still rather segmented, unstable, and sometimes controversial. However, we were able to make it work and we are proud of the result.
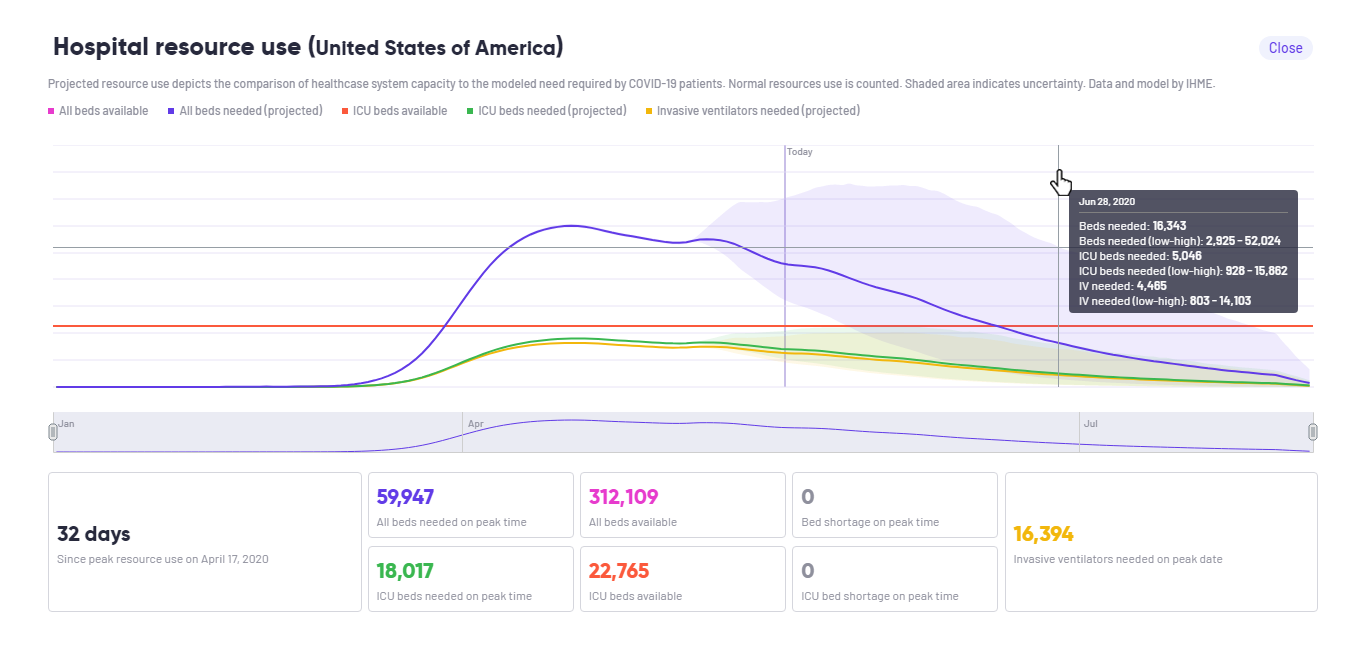
When comparing the existing state and the initial vision, we can see that we have updated StopCorona significantly, adding many trends and predictive analytics that were not present in our initial version. We are constantly adapting to the coming trends and adjusting the application accordingly to the needs of users.
We look forward to the upcoming easing of lockdown in many countries and plan our roadmap of new features which will be useful for users tomorrow.
A: How important for StopCorona is data visualization?
VP: Data visualization plays a critical role in StopCorona, as reflecting the insights of multidimensional and complex data for common users is the main goal of our system.
A: How do you use AnyChart in the StopCorona project? What kind of data does AnyChart visualize? What chart types and features are most helpful?
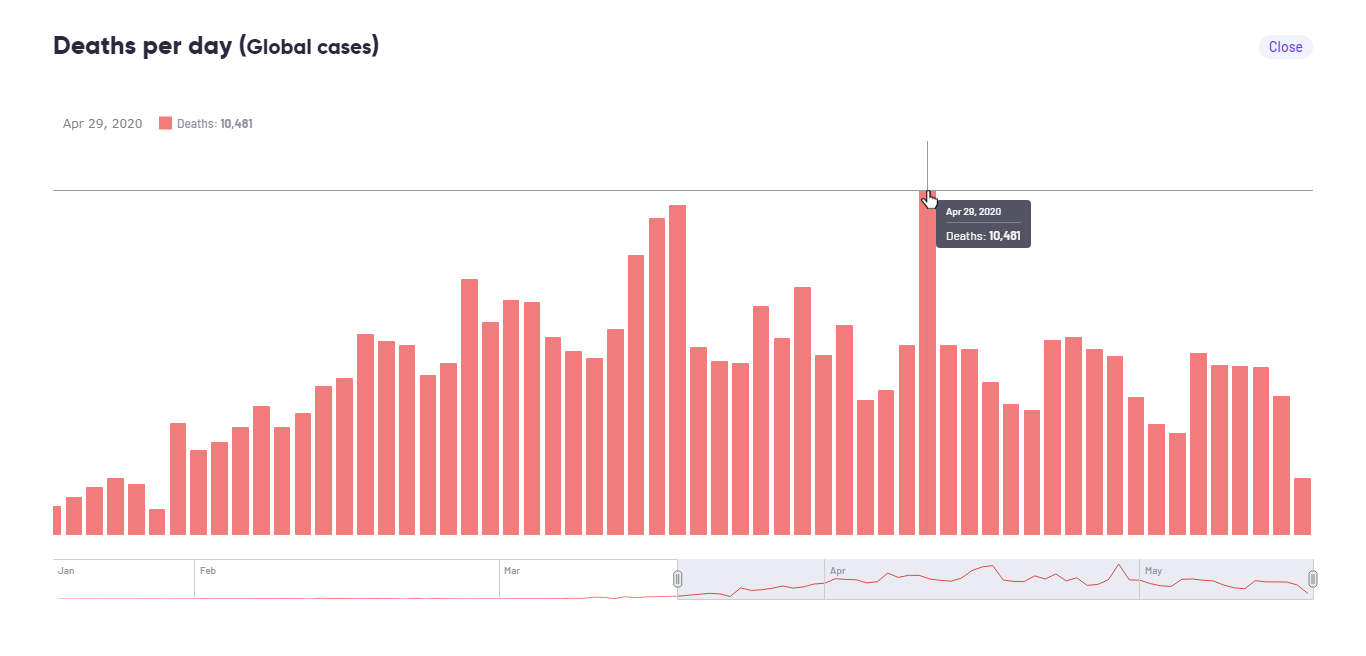
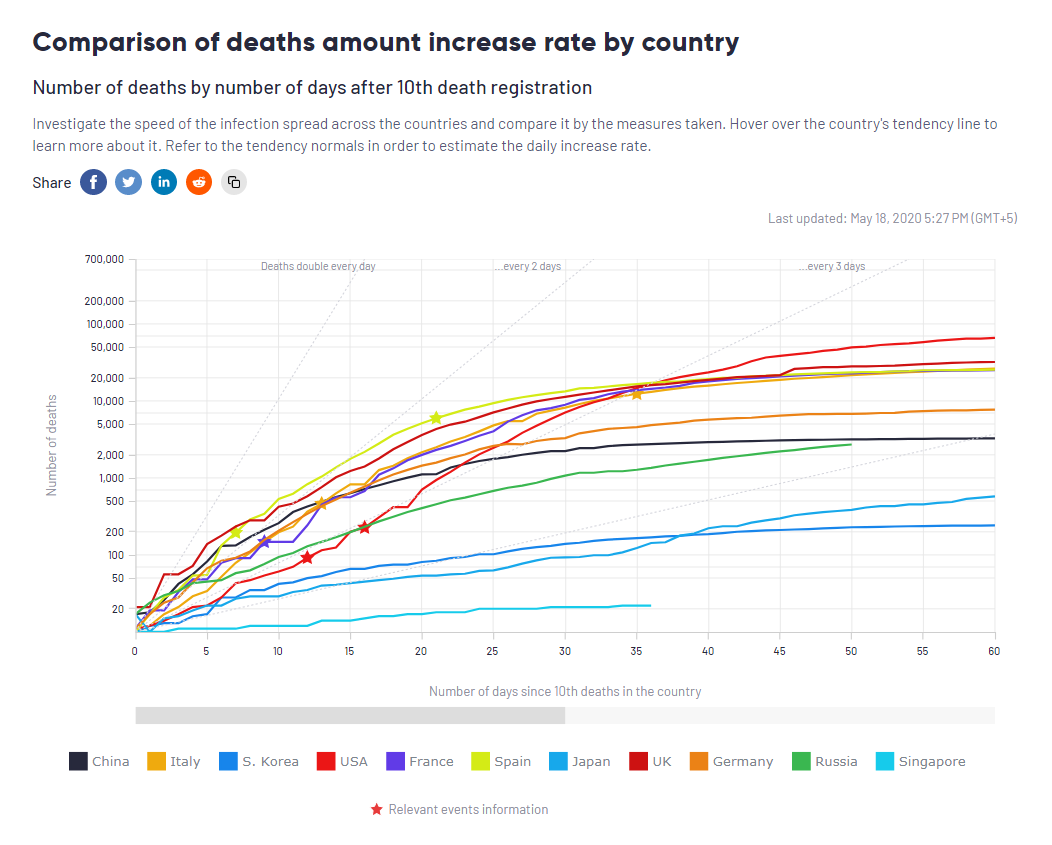
VP: We use AnyChart in StopCorona as the main charting library. Mostly, we utilize chart options to interpret numerical data structures over time, hence line and bar charts are the most used ones in StopCorona now.
We highly appreciate different AnyChart tools to dynamically modify the graph segmentation and depth of the timeline. It makes all charts more convenient and effective on a user’s side, allowing users to look at the same data from different perspectives.
A: What technology stack is StopCorona built on? Was integration of AnyChart into your stack somewhat seamless and easy enough or did you face any problems?
VP: StopCorona is a progressive web application, which is built on Angular and Symfony frameworks. We are running on Oracle, AWS clouds, Kubernetes to be flexible, and scalable. We process data rather effectively due to the right configuration of Redis, Memcache, and MySQL, they absolutely fit our needs.
AnyChart was very easy to integrate into our stack, we did not have any configuration issues or dependency conflicts. That’s one of the core benefits of utilizing AnyChart from our perspective.
A: Why did you choose AnyChart? What do you like most about our charting library?
VP: At Diffco we were familiar with AnyChart before and had been watching for your activity for a long time, while your product received many awards and positive feedback. When we were starting StopCorona, AnyChart was at the top of our testing list of chart libraries.
We are happy that AnyChart satisfied our needs and helped StopCorona to move faster with great data visualization. In addition to easy integration, we can definitely mention a vast set of chart types AnyChart has out of the box. It saves your time and encourages you to be more creative.
A: Please tell us how we can further improve AnyChart: What do you think it lacks and what would you like to see in the future releases?
VP: AnyChart is a completed solution, yet the development towards more features for native mobile users and touch UI would be impressive.
A: When asked by a friend which JS charting library to use for data visualization, how would you recommend AnyChart and explain why in one phrase?
VP: We highly recommend AnyChart because of its simple installation, clear documentation, friendly support, and rich set of chart types for your data visualizations of any type.
A: What do you think about COVID-19 and our future?
VP: COVID-19 is a big challenge for humanity, yet, with no doubt it would be handled. We believe that we should approach it steadily and without panic and StopCorona is our small contribution to it.
Take a look at the StopCorona case study we’ve just published as well and see other selected case studies.
Also, you are welcome to check out more customer stories.
If you want to share your AnyChart story, please let us know.
- Categories: AnyChart Charting Component, Big Data, Charts and Art, HTML5, JavaScript, Success Stories
- 3 Comments »