Visualizing Diversity and Absence in Schools, Child Mortality, and Debate Topics — DataViz Weekly
September 20th, 2019 by AnyChart Team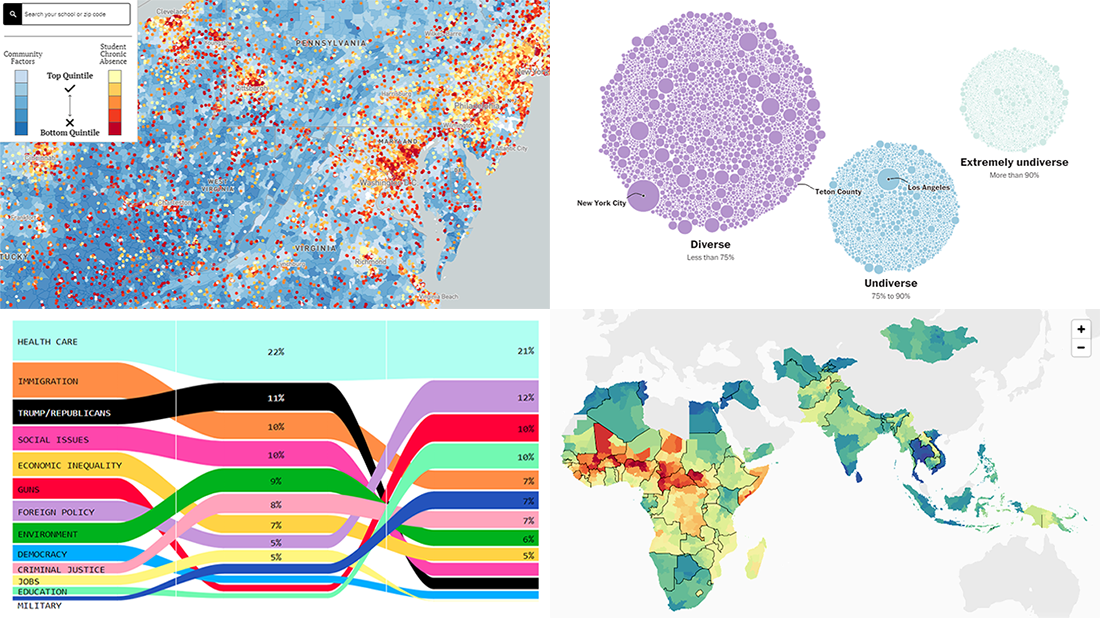 Enjoy new awesome chart examples! The following cool projects visualizing diversity and integration, presidential debate topics, and more have captured our attention this week, and we’re excited to feature them now within the framework of the DataViz Weekly series on AnyChart Blog:
- Chronic absence in U.S. schools
- Racial diversity across all America’s school districts
- Child mortality in low-to-middle-income countries
- Top issues discussed at the first three Democratic debates
- Categories: Data Visualization Weekly
- No Comments »
Excellent Visualizations on Subway, Moons, Energy, and Sea Ice — DataViz Weekly
July 12th, 2019 by AnyChart Team Many excellent visualizations have appeared this week around the web. Now it’s time to choose four and briefly introduce them to you — that’s what we’ve been doing for years within the framework of the special DataViz Weekly feature on our blog.
Alright. We invite you to take a look at the following new cool projects as another set of great data visualization examples, for your inspiration and fun:
- Variability in the New York subway commutes — The Upshot
- Moons in our solar system — National Geographic
- Energy consumption worldwide since 1980 — Bloomberg
- Sea ice extents since 1979 — ArcGIS Blog
- Categories: Data Visualization Weekly
- No Comments »
New Cool Diagrams, Graphs, and Maps Visualizing Interesting Data — DataViz Weekly
June 21st, 2019 by AnyChart Team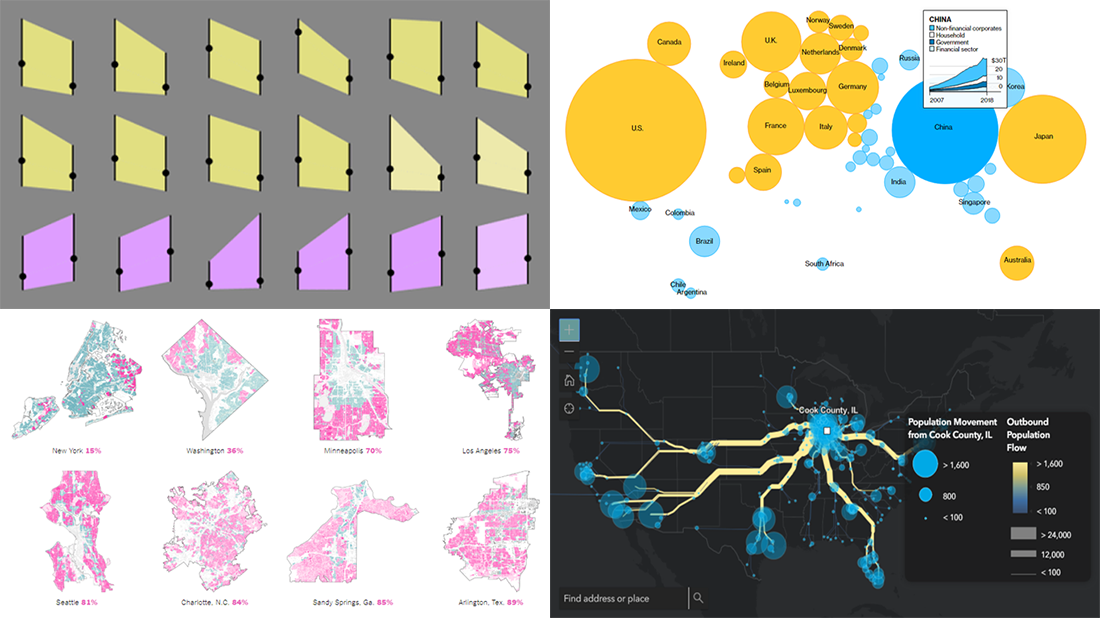 Generally, data becomes much easier to make sense of when it is visualized in diagrams, maps, or other forms of graphics. DataViz Weekly shows you examples of how this is true in reality. Today, we’ve put together another four of the latest data visualization projects discovered by our team around the internet. They bring insight into the following topics:
- Single-family home zoning in the United States of America
- Time use of parents vs people without kids
- Debt of emerging market countries
- U.S. internal migration
- Categories: Data Visualization Weekly
- 1 Comment »
Most Interesting Data Visualization: GBP, EU Election, MHW, Bob Ross — DataViz Weekly
June 7th, 2019 by AnyChart Team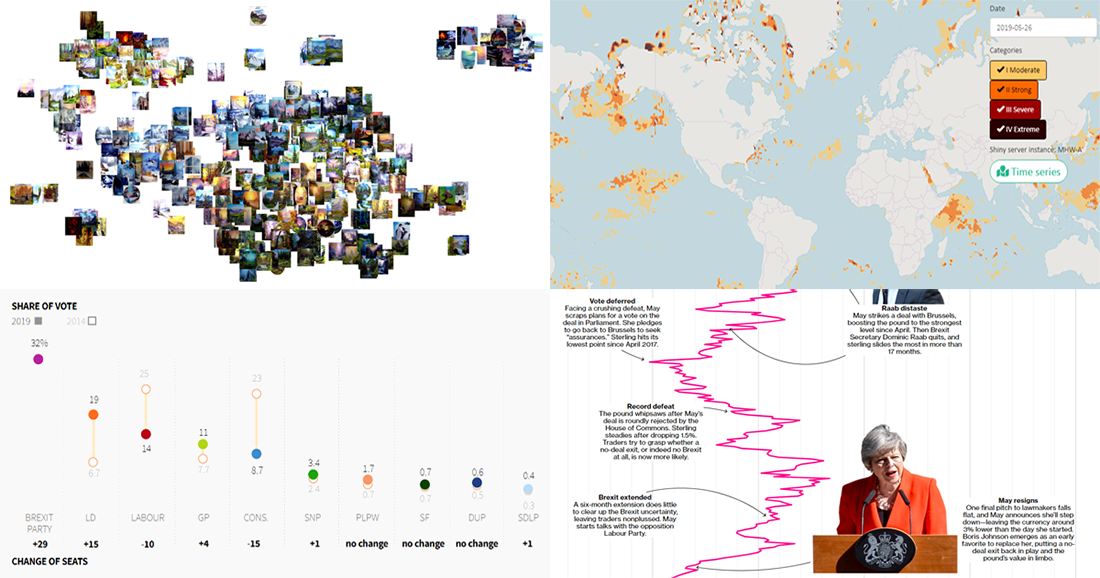 Take a look at four of the most interesting data visualization projects and stories we have found around the web during the last few days. Here’s what we feature today in DataViz Weekly:
- GBP rate change in the context of Brexit turns
- European Parliament election in the United Kingdom
- Marine Heatwave Tracker
- Evolution of Bob Ross’s famous phrases over all 403 episodes of The Joy of Painting
- Categories: Data Visualization Weekly
- No Comments »
Graphics Visualizations About Immigration, Elections, Pitchers, and Salinity — DataViz Weekly
May 17th, 2019 by AnyChart Team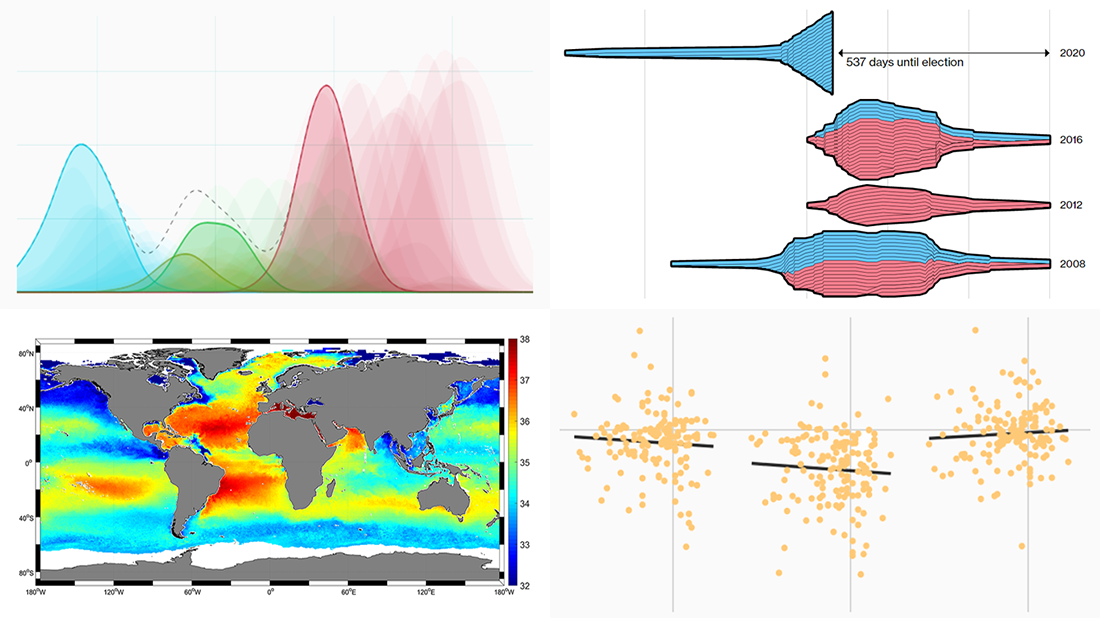 New DataViz Weekly is here, highlighting some of the new cool graphics visualizations we found around the web just recently:
- Finding a link between undocumented immigration and crime in the United States
- Competition in the U.S. presidential elections since 1980
- MLB pitchers’ pitch distribution
- Sea-surface salinity
- Categories: Data Visualization Weekly
- No Comments »
Compelling Data Visualization Examples on Trade, Diets, Mortality, and Birth Rates — DataViz Weekly
May 10th, 2019 by AnyChart Team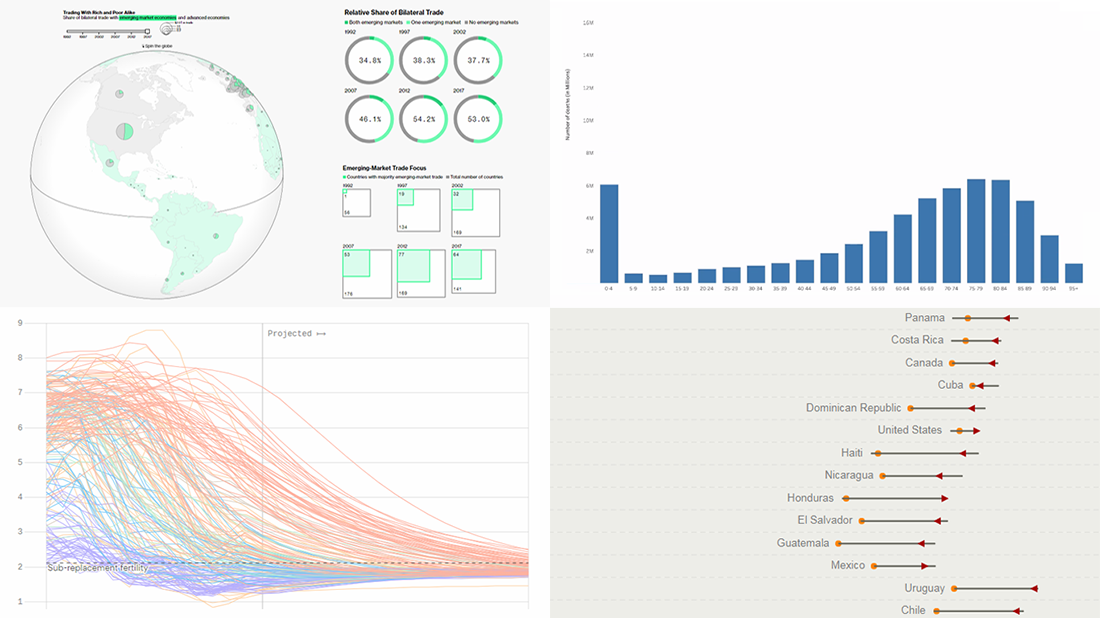 Take a look at another set of compelling data visualization examples we have come across these days, in DataViz Weekly on the AnyChart blog:
- Rise of developing countries in global trade
- Birth rates
- Growing similarity of diets
- Child mortality
- Categories: Data Visualization Weekly
- No Comments »
Visual Data Graphics on EU Regions, Freedom of Press, IMF Forecasts, and Climate Change — DataViz Weekly
April 26th, 2019 by AnyChart Team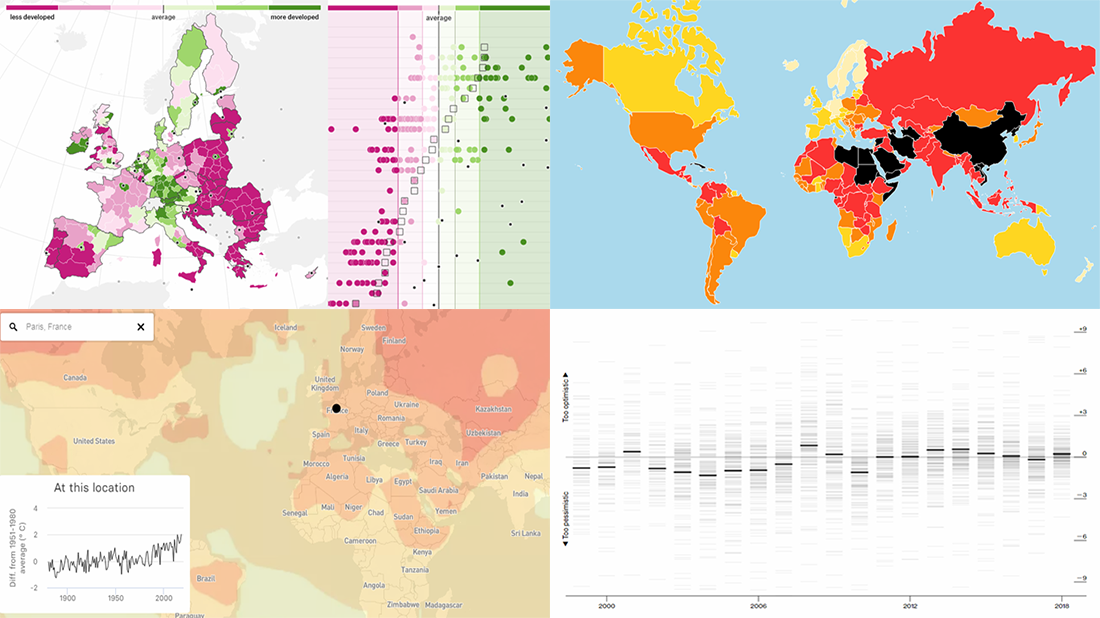 Get ready for another dose of cool visual data graphics — DataViz Weekly is here! Today we are glad to acquaint you with the following new interesting projects:
- The Pudding explains why EU regions redraw their borders.
- Reporters Without Borders shares its annual World Press Freedom Index for 2019.
- Bloomberg analyzes errors in the International Monetary Fund’s spring forecasts of same-year GDP growth.
- BuzzFeed visualizes how climate change has already transformed the planet.
- Categories: Data Visualization Weekly
- No Comments »
Analyzing Trump Speech, Green Infrastructure in London, GE’s Rise and Downfall, NYC Traffic Collisions — DataViz Weekly
February 15th, 2019 by AnyChart Team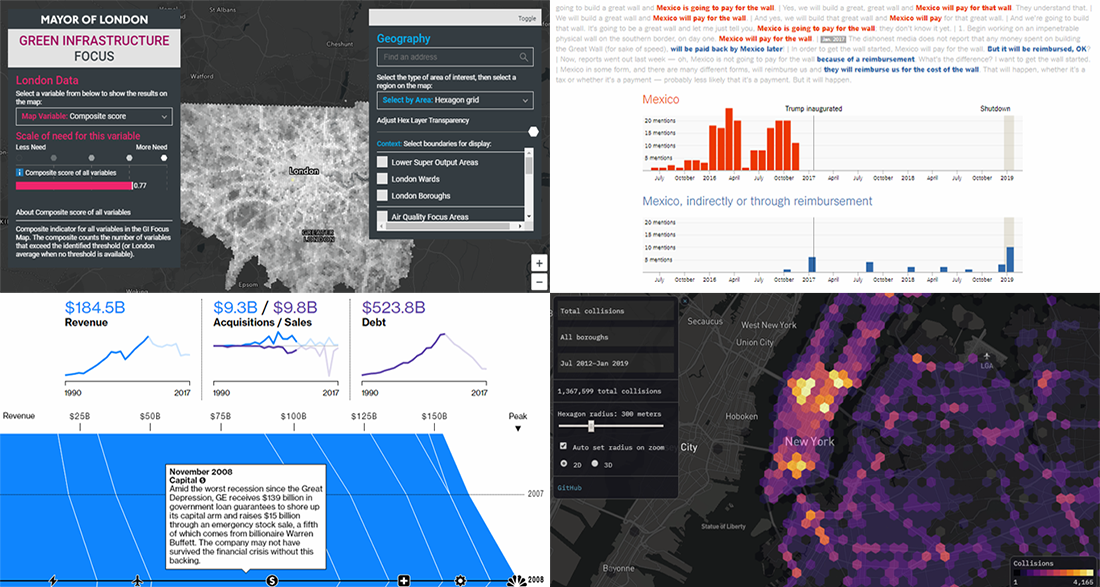 The new cool interesting data visualization projects we praise today on DataViz Weekly are helpful in analyzing Trump speech regarding the U.S.-Mexico wall, green infrastructure in London, rise and downfall of General Electrics, and traffic collisions in New York City. Take a quick look.
- Categories: Data Visualization Weekly
- No Comments »
Tesla Sales, Brexit Vote, Birth Costs, Health Disparities — DataViz Weekly
January 25th, 2019 by AnyChart Team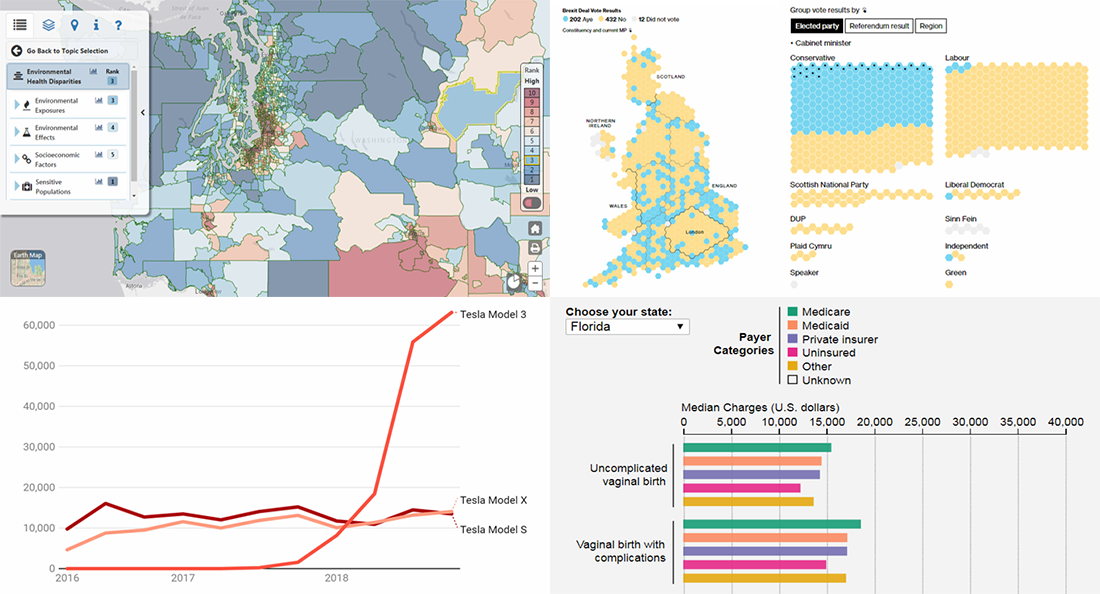 In the new DataViz Weekly post, we highlight interesting interactive data visualizations that have come to our attention this week. Take a look at charts showing details about Tesla sales, Brexit vote in the British Parliament, birth charges in American hospitals, and environmental health disparities in the Washington state.
- Categories: Data Visualization Weekly
- No Comments »