 Many excellent visualizations have appeared this week around the web. Now it’s time to choose four and briefly introduce them to you — that’s what we’ve been doing for years within the framework of the special DataViz Weekly feature on our blog.
Alright. We invite you to take a look at the following new cool projects as another set of great data visualization examples, for your inspiration and fun:
- Variability in the New York subway commutes — The Upshot
- Moons in our solar system — National Geographic
- Energy consumption worldwide since 1980 — Bloomberg
- Sea ice extents since 1979 — ArcGIS Blog
Data Visualization Weekly with New Excellent Visualizations: July 5, 2019 — July 12, 2019
Variability in NYC Subway Commutes
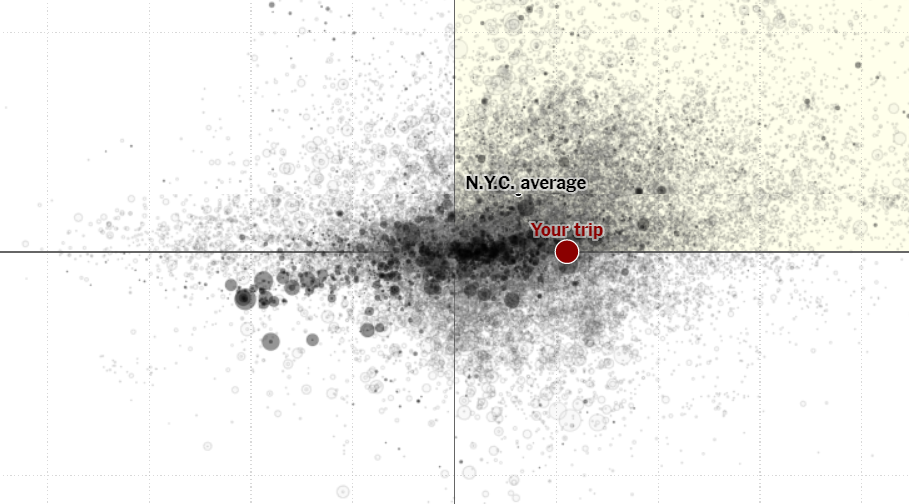
Kevin Quealy and Josh Katz decided to look into variability in New York subway commutes. The reason for choosing this particular topic is that most of the subway statistics fail to spot it, according to them, although this aspect of the city commuting system actually means a lot. Check out their recent piece on The Upshot to learn about the distribution of possible travel times for any selected route, see how these changed in the last year, compare it with a similar trip in London’s Tube, and get some other interesting insights.
Generally, most commutes in the subway have improved in terms of trip duration and how predictable it is. But there are still a lot of problems in this matter.
The project is based on visualization and analysis of trip data from the Metropolitan Transportation Authority (MTA).
Moons in Our Solar System
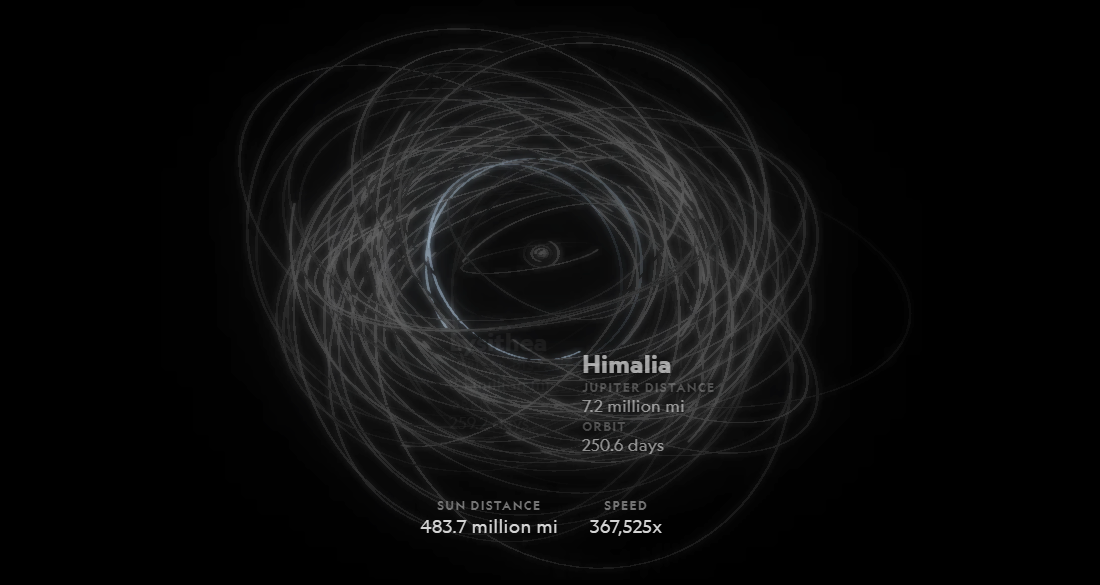
Although Mercury and Venus have no known moons, the others in our solar system do: Earth has 1, Mars — 2, Jupiter — 67, Saturn — 61, Uranus — 27, Neptune — 14, and Pluto — 5. Want to know more about them? Check out The Atlas of Moons published this Tuesday on National Geographic.
It is a fascinating visual guide to the major moons in our solar system, providing a lot of interesting information and figures about them, their orbits, history, and more.
Beware as you may well forget about time and accidentally find yourself having spent hours on exploring this project.
Energy Consumption Worldwide Since 1980
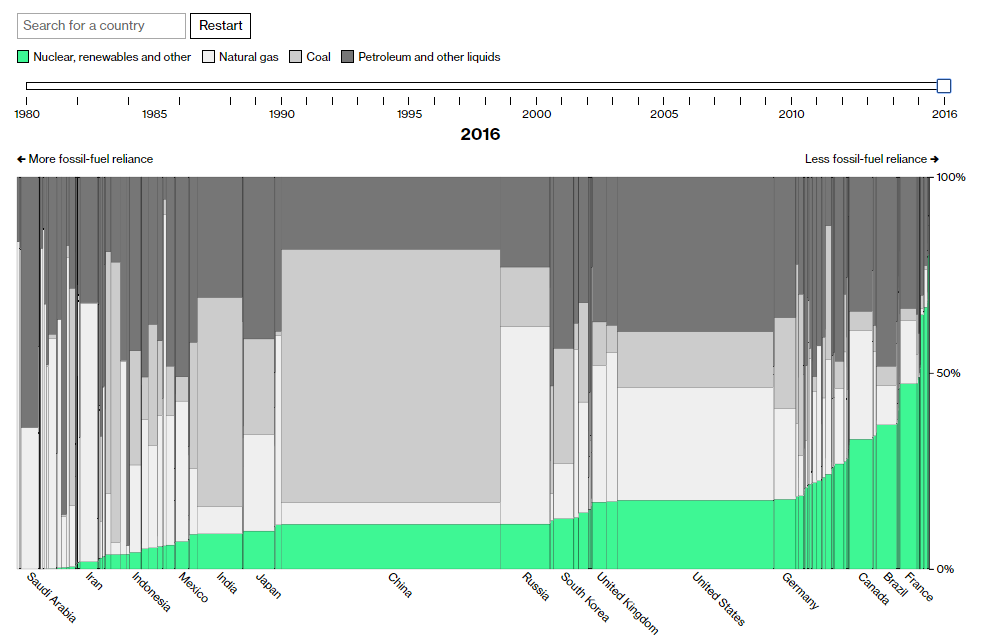
Nowadays, the entire world consumes almost twice as much energy as in 1980. To find out what’s each country’s contribution to such a quick rise, Lauren Leatherby and Chris Martin turned to data from the International Energy Statistics database of the U.S. Energy Information Agency.
Use the core visualization tool in their this week’s article to explore the share of total primary energy consumption by country and source in 1980-2016. It is interactive, so when you hover over around, you see country-specific charts in the tooltip; charts for the United States, United Kingdom, China, France, Japan, Germany, India, South Korea, Iceland, and Saudi Arabia are additionally featured further down the article as illustrations for several instances worth noting.
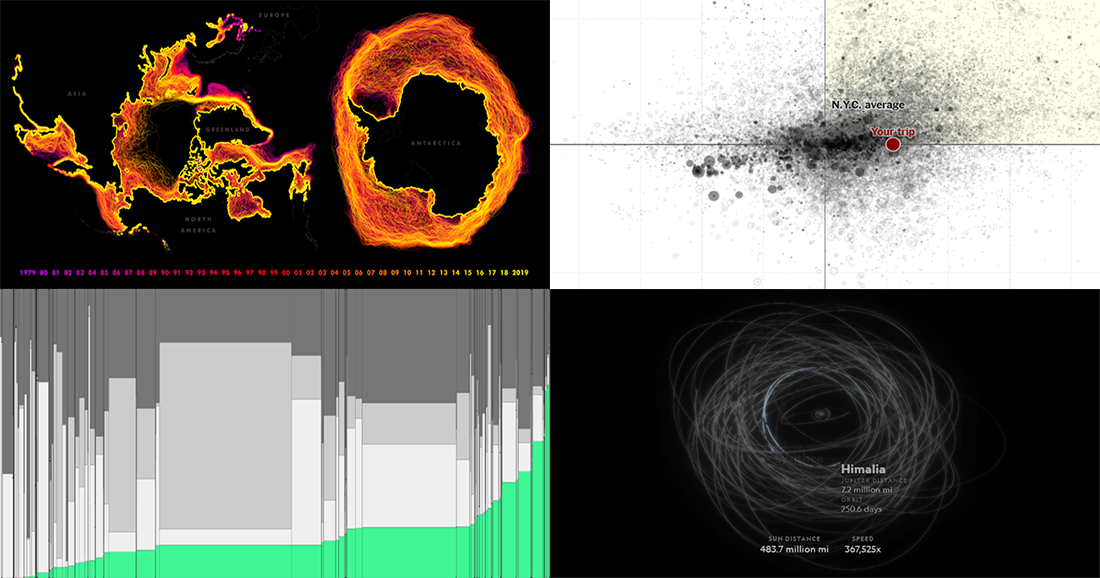
Sea Ice Extents Since 1979
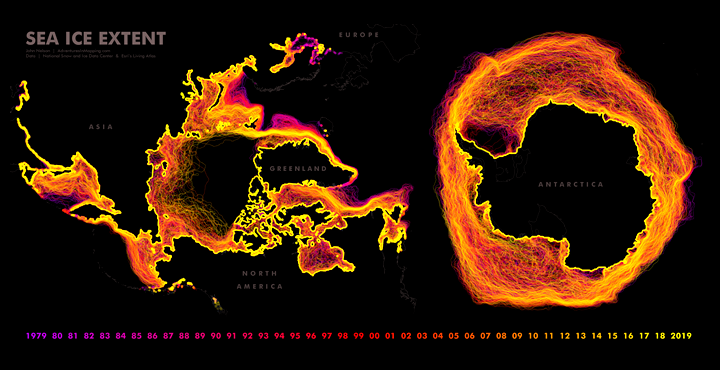
John Nelson, an expert in data visualization, made a series of impressive maps to represent how the sea ice extents in the Arctic and Antarctic have changed over the past forty years. To create this project, he used National Snow and Ice Data Center (NSIDC) data from the ArcGIS Living Atlas.
Check out John Nelson’s new great data visualization work on ArcGIS Blog. The project begins with a cool animated visualization of the sea ice extent change in 1979-2019. Start right there and then take a deeper dive.
***
Have a wonderful time! And stay tuned for Data Visualization Weekly to not miss new excellent visualizations worth checking out!
- Categories: Data Visualization Weekly
- No Comments »