 Generally, data becomes much easier to make sense of when it is visualized in diagrams, maps, or other forms of graphics. DataViz Weekly shows you examples of how this is true in reality. Today, we’ve put together another four of the latest data visualization projects discovered by our team around the internet. They bring insight into the following topics:
- Single-family home zoning in the United States of America
- Time use of parents vs people without kids
- Debt of emerging market countries
- U.S. internal migration
Diagrams, Graphs, and Maps in Data Visualization Weekly: June 14, 2019 — June 21, 2019
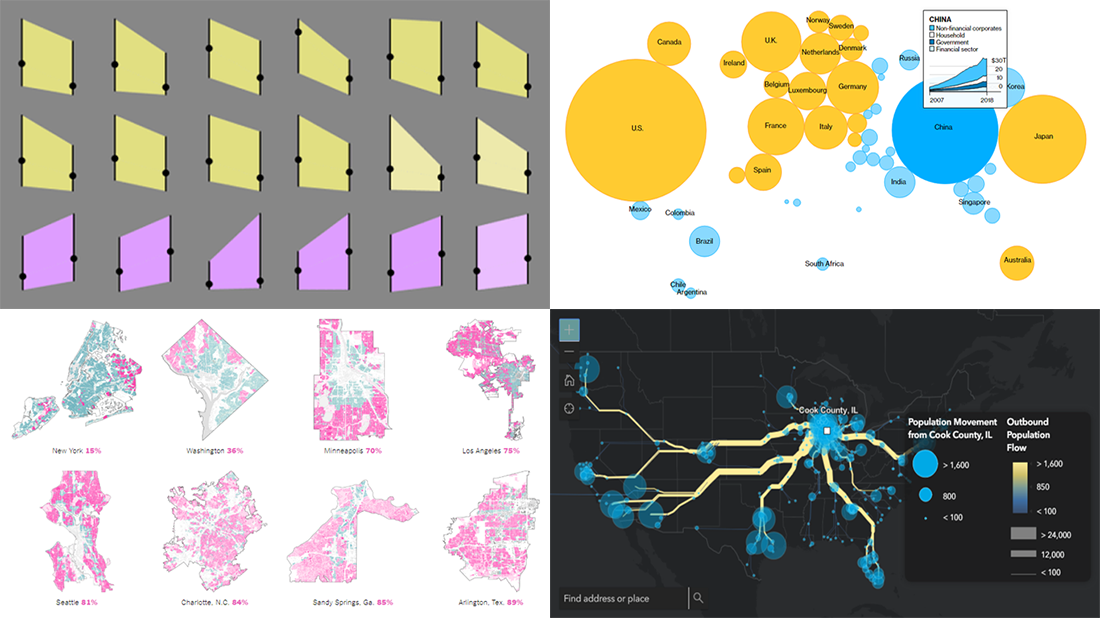
Single-Family Home Zoning in America
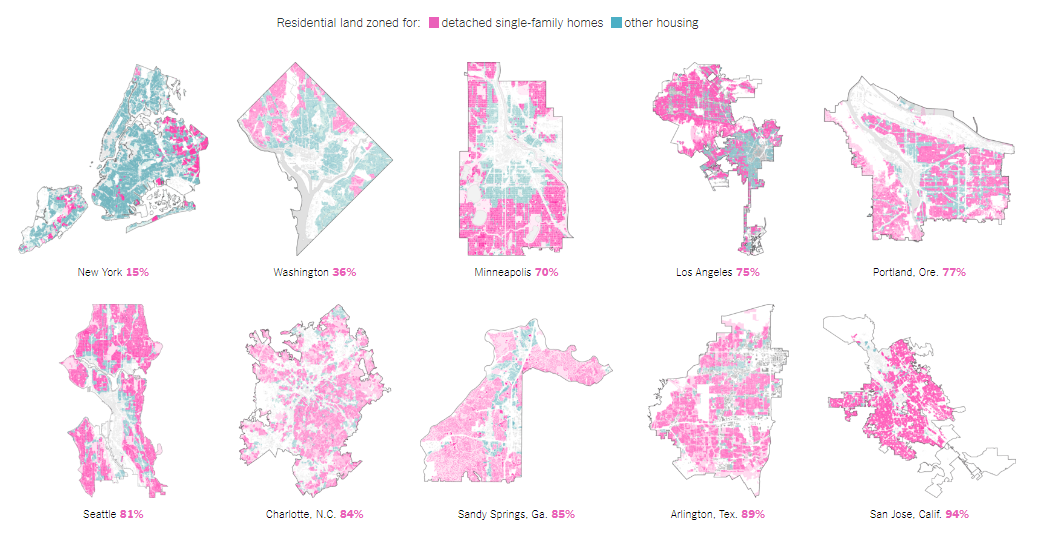
Living in a detached single-family home is usually considered to be a significant part of the American dream, with single-family zoning in the United States designed to protect neighborhoods consisting of private houses with yards from denser development such as townhouses, apartments, and so on. However, officials are beginning to question this approach “amid mounting crises over housing affordability, racial inequality and climate change.”
Join Emily Badger and Quoctrung Bui on The Upshot as they dive into this issue, exploring how residential land across the United States is currently zoned for single-family homes and what plans cities have in mind.
Time Use of Parents
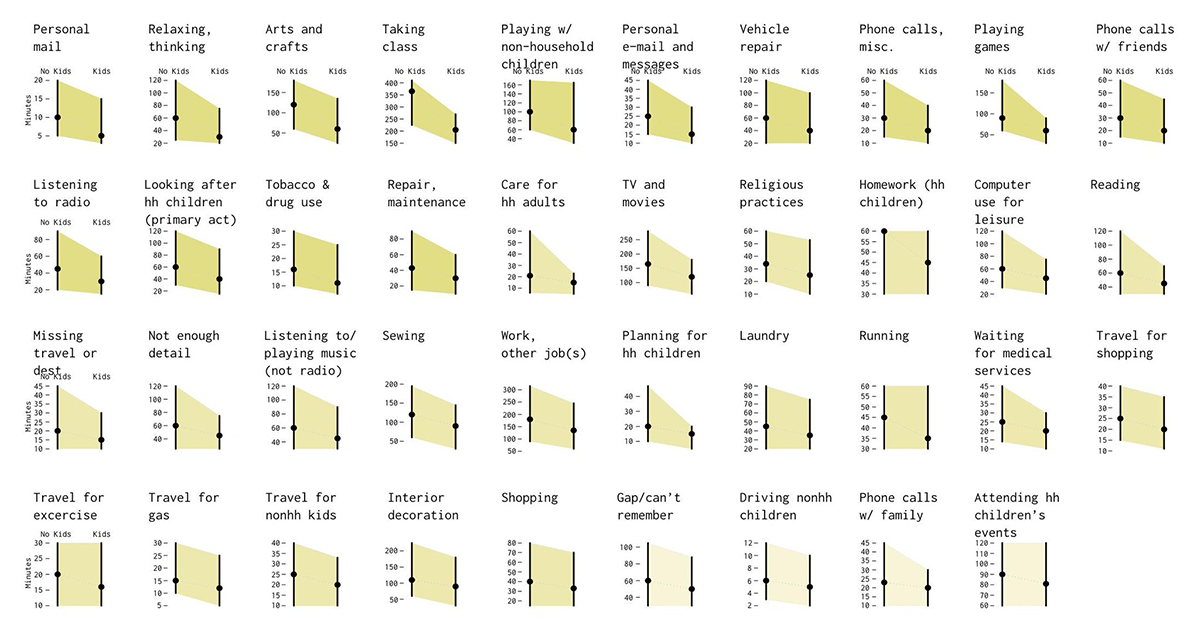
Having kids makes everyday life really different. They indeed require a lot of attention and time that you have to take from something else you did before.
Nathan Yau, an expert in statistics and data visualization, offers a look into what changes in the everyday of Americans when they become parents and how much. See his visualizations of the corresponding data from the American Time Use Survey, comparing time use for people with kids under 18 years old against those without.
Debt of Emerging Market Countries
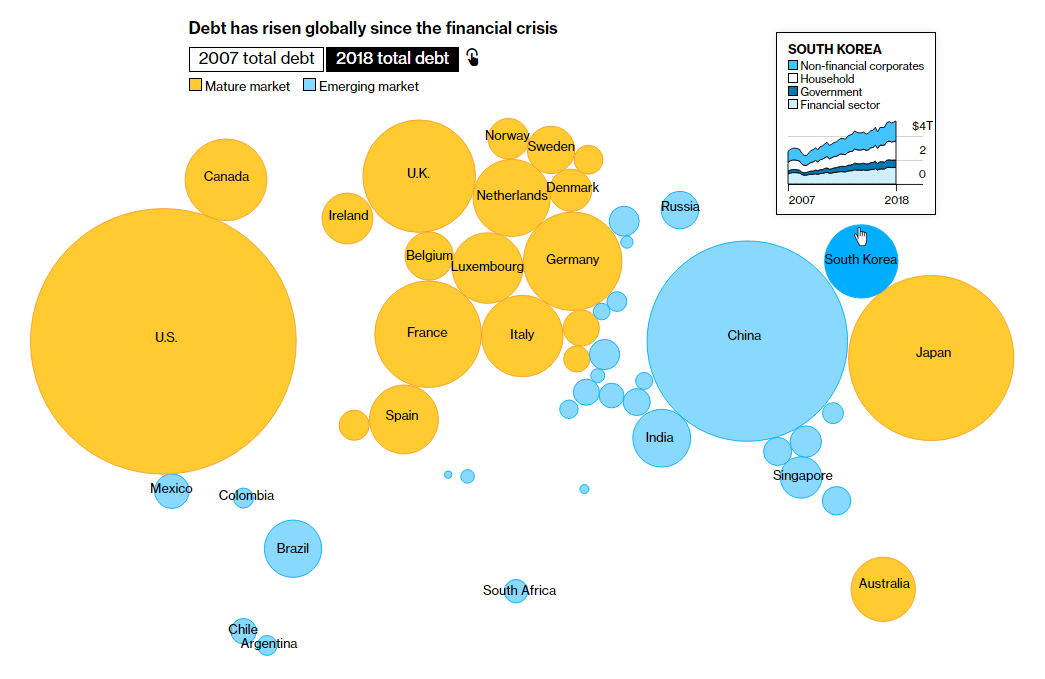
Since the global financial crisis, debt has risen worldwide, especially in China, which is seen by experts as concerning. In fact, the more debt, the more risk.
John Authers and Lauren Leatherby provide an attempt to analyze why emerging markets fail to be growth engines and take off as China’s debt balloons. Check out multiple interesting charts and diagrams on the debt issue in their newly published story on Bloomberg.
U.S. Population Migration
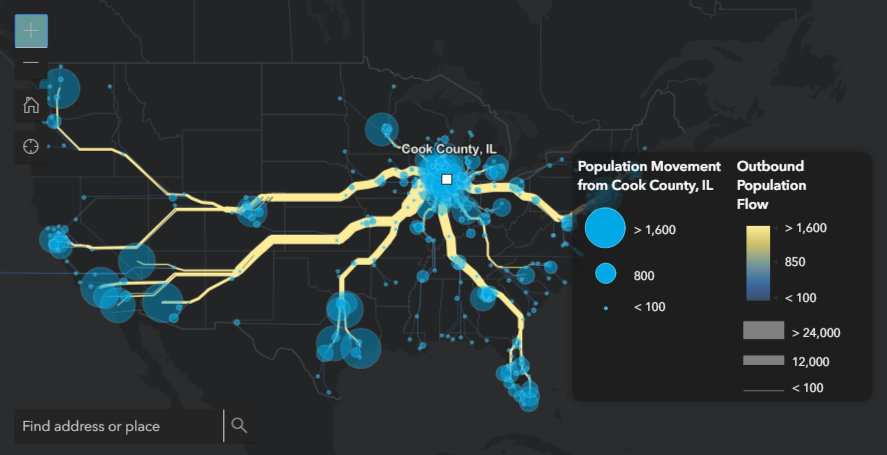
When an American citizen moves from one state to another, the Internal Revenue Service (IRS) records such a change of residence at the time when one files taxes in a new place of living.
The Esri Policy Maps Team used this IRS data to visualize the internal migration paths across the United States. Look at the inbound and outbound population migration directions and quantities for states and counties and how these changed.
***
Don’t miss out on these cool diagrams, maps, and graphs. And stay tuned for our weekly feature Data Visualization Weekly.
- Categories: Data Visualization Weekly
- 1 Comment »