Qlik Sense Visualization Extensions AnyChart, AnyStock and AnyGantt Updated with New Features
July 16th, 2020 by AnyChart Team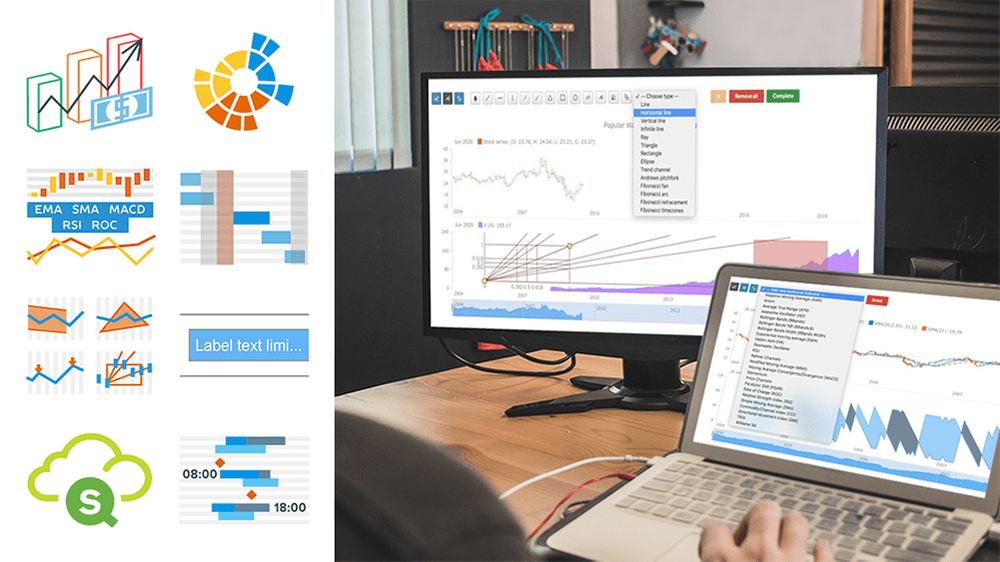 A number of new powerful capabilities are now available in our extensions for Qlik Sense! The new features are designed to help speed up data analysis in the native Qlik environment, making it even more intuitive and workflows streamlined.
Read more at qlik.anychart.com »
- Categories: AnyChart Charting Component, AnyGantt, AnyStock, Big Data, Business Intelligence, Financial Charts, Gantt Chart, News, Qlik, Stock Charts
- No Comments »
Making JS Candlestick Chart in Four Simple Steps
March 25th, 2020 by Anastasia Zoumpliou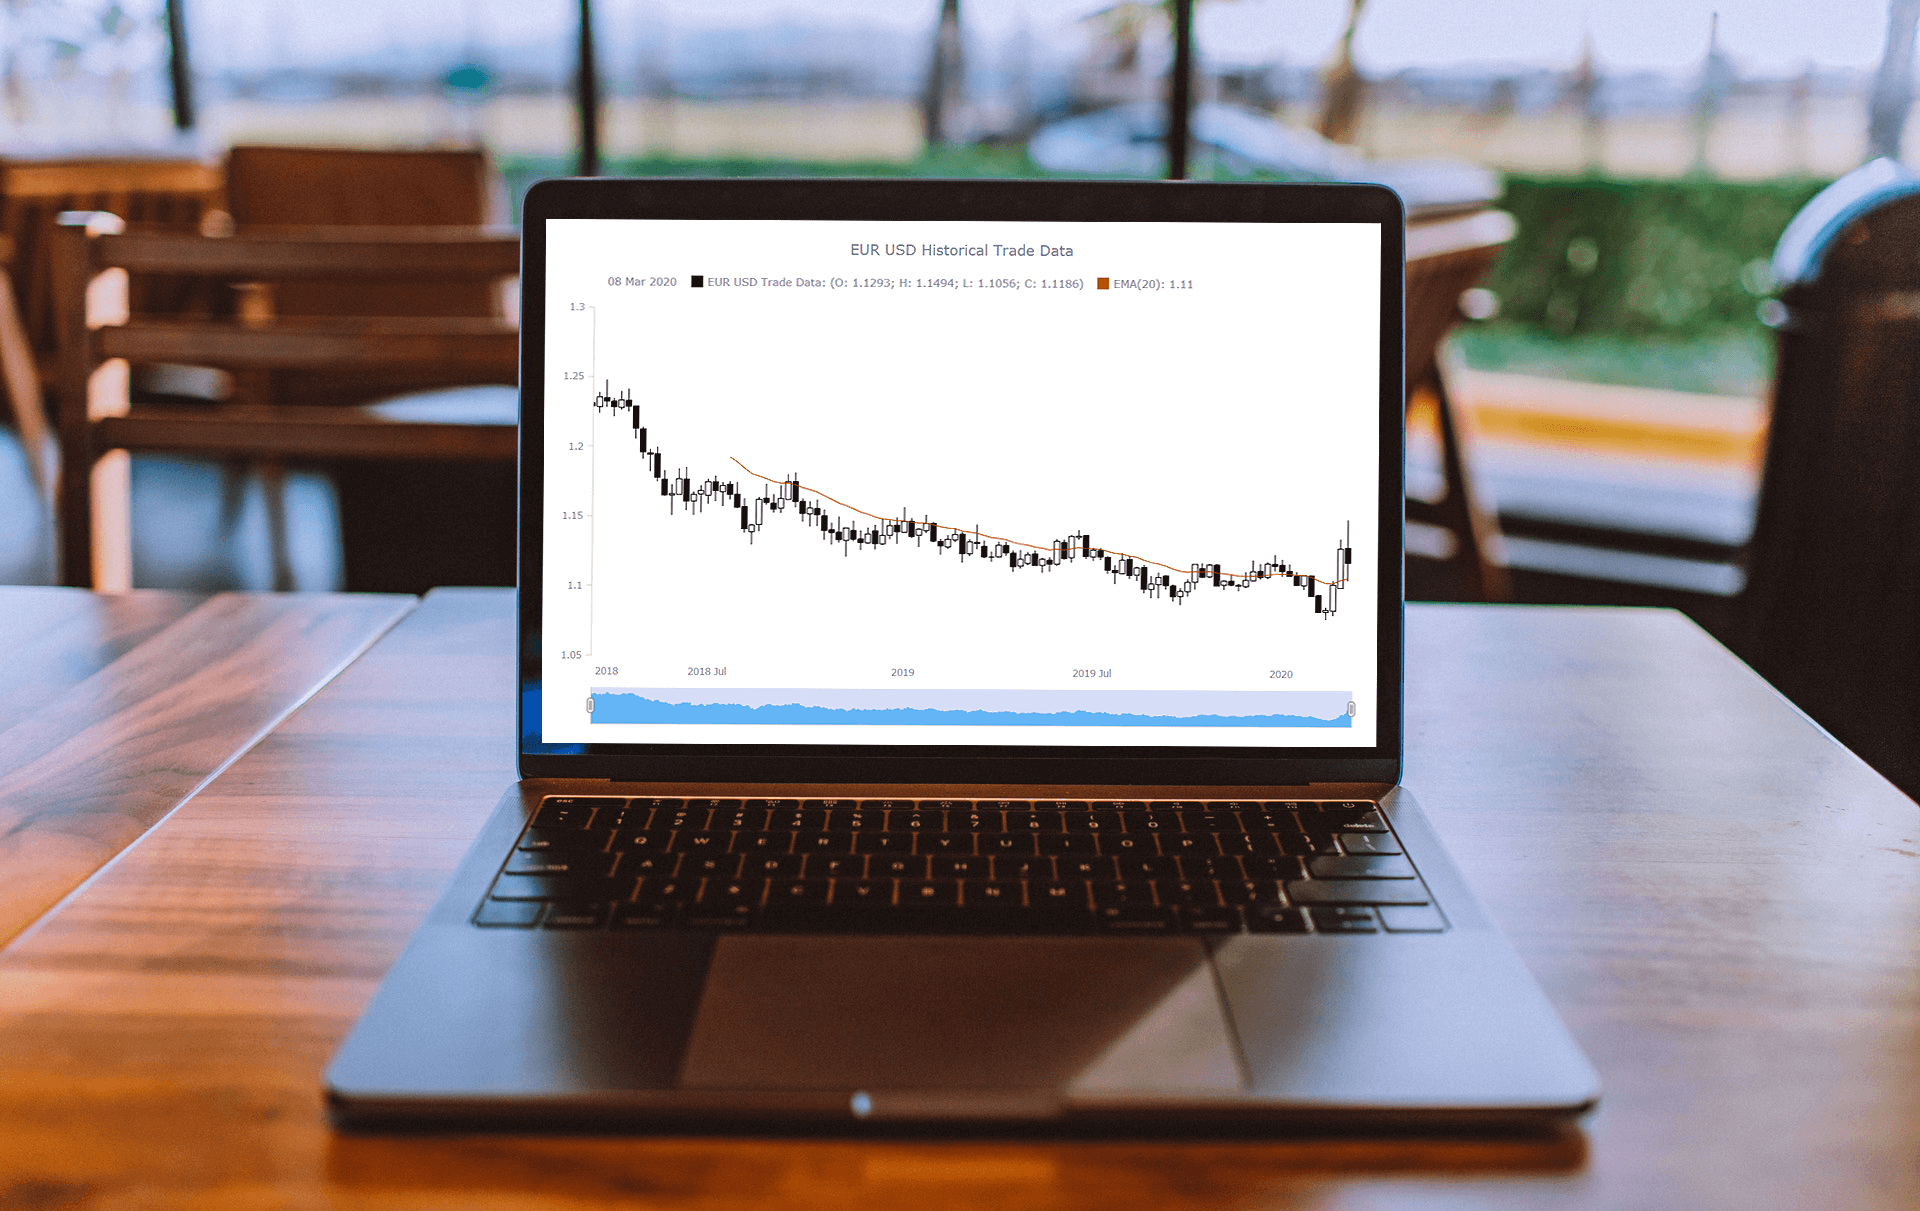 Do you have trading data, looking for a way to effectively visualize it for your website or app project? If so, a JS candlestick chart could be your best pick. This tutorial will break down the process needed to create such a chart into simple steps and provide a detailed explanation of the code. Keep reading even if you are new to programming, because only a basic understanding is needed to follow along and master such a JavaScript (HTML5) based data visualization technique.
Also called a Japanese candlestick chart, this chart type is one of the most popular forms of financial and stock data visualization. Each candlestick represents information about the open, high, low, and close price of the day. Candlestick charts are widely used in technical analysis of price movement patterns.
Complete this tutorial and you will be able to create a compelling interactive candlestick chart in JavaScript real quick, with ease.
Read the JS charting tutorial »
- Categories: AnyChart Charting Component, AnyStock, Big Data, Financial Charts, HTML5, JavaScript, JavaScript Chart Tutorials, Stock Charts, Tips and Tricks
- No Comments »
AnyChart JS Charts 8.7.1 Is Ready for Download — Enjoy New Version!
January 28th, 2020 by AnyChart Team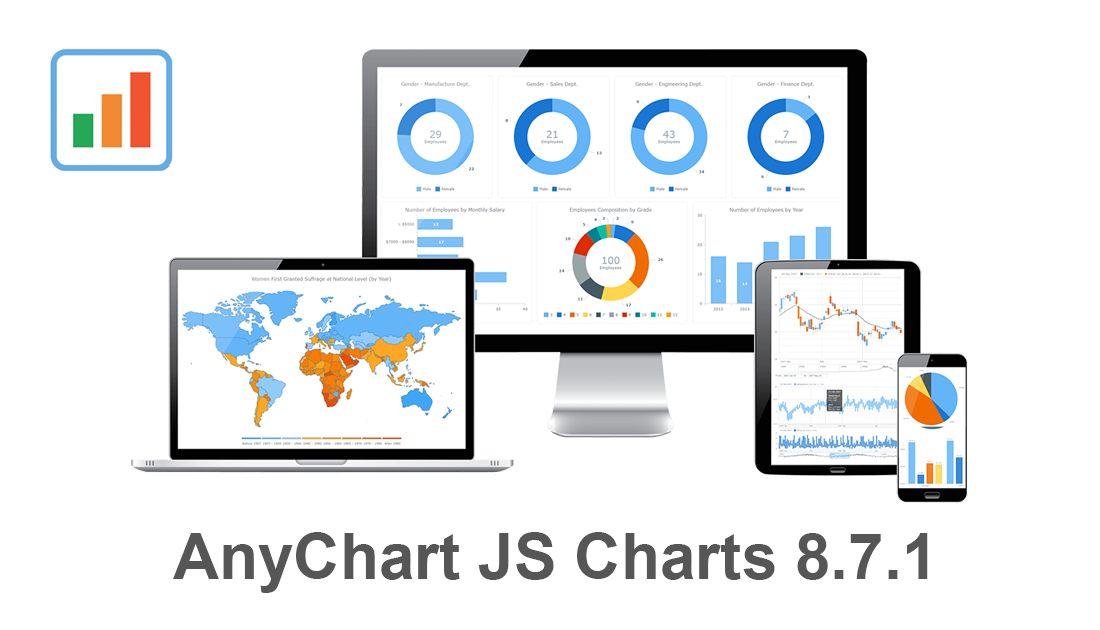 Our JavaScript charting libraries are now updated! Just before the new year, we delivered important fixes and improvements to them in version 8.7.1. These updates make it even better to visualize data using our flexible visualization solutions for cross-platform HTML5 charting — AnyChart JS for basic charts, AnyGantt JS for project and resource charts, AnyStock JS for stock and any other time-series charts, and AnyMap JS for geographical and seat map charts.
Download version 8.7.1 now and start enjoying our updated JavaScript charting libraries!
Check the version history of the library you are using to see exactly what has been improved and fixed in the new release:
Let us know what else we should add or enhance. We’ve been always listening to you and your feedback has always largely determined our roadmap. Of course, this will remain so in the new year (and beyond). Any questions, give us a shout and we’ll be happy to assist you asap.
We wish you a happy and prosperous 2020!
- Categories: AnyChart Charting Component, AnyGantt, AnyMap, AnyStock, Big Data, Business Intelligence, Dashboards, Financial Charts, Gantt Chart, HTML5, JavaScript, News, Stock Charts
- No Comments »
AnyChart Recognized in Top 10 Business Intelligence and Analytics Companies of 2019
November 19th, 2019 by AnyChart Team We are excited to announce that Analytics Insight, a magazine that covers big data and business intelligence developments, included AnyChart in The 10 Next Generation BI and Analytics Companies of 2019 — “for providing the most advanced solutions and playing a significant role in shaping the future of these disruptive technologies.”
The list has been made public in the just-released November issue of the magazine and is accompanied by the stories about each featured company. With permission of Analytics Insight, today we are republishing the magazine’s story about us on our blog — “AnyChart: Turning Data into Actionable Insights with Award-Winning Data Visualization Solutions.”
Read the story of AnyChart as it appeared on Analytics Insight »
- Categories: AnyChart Charting Component, AnyGantt, AnyMap, AnyStock, Big Data, Business Intelligence, Charts and Art, Dashboards, Financial Charts, Flash Platform, Gantt Chart, GraphicsJS, HTML5, Interesting Facts, JavaScript, News, Success Stories
- No Comments »
JavaScript Graph Visualization Libraries Updated — Check Out AnyChart 8.7.0 with New Awesome Features!
August 8th, 2019 by AnyChart Team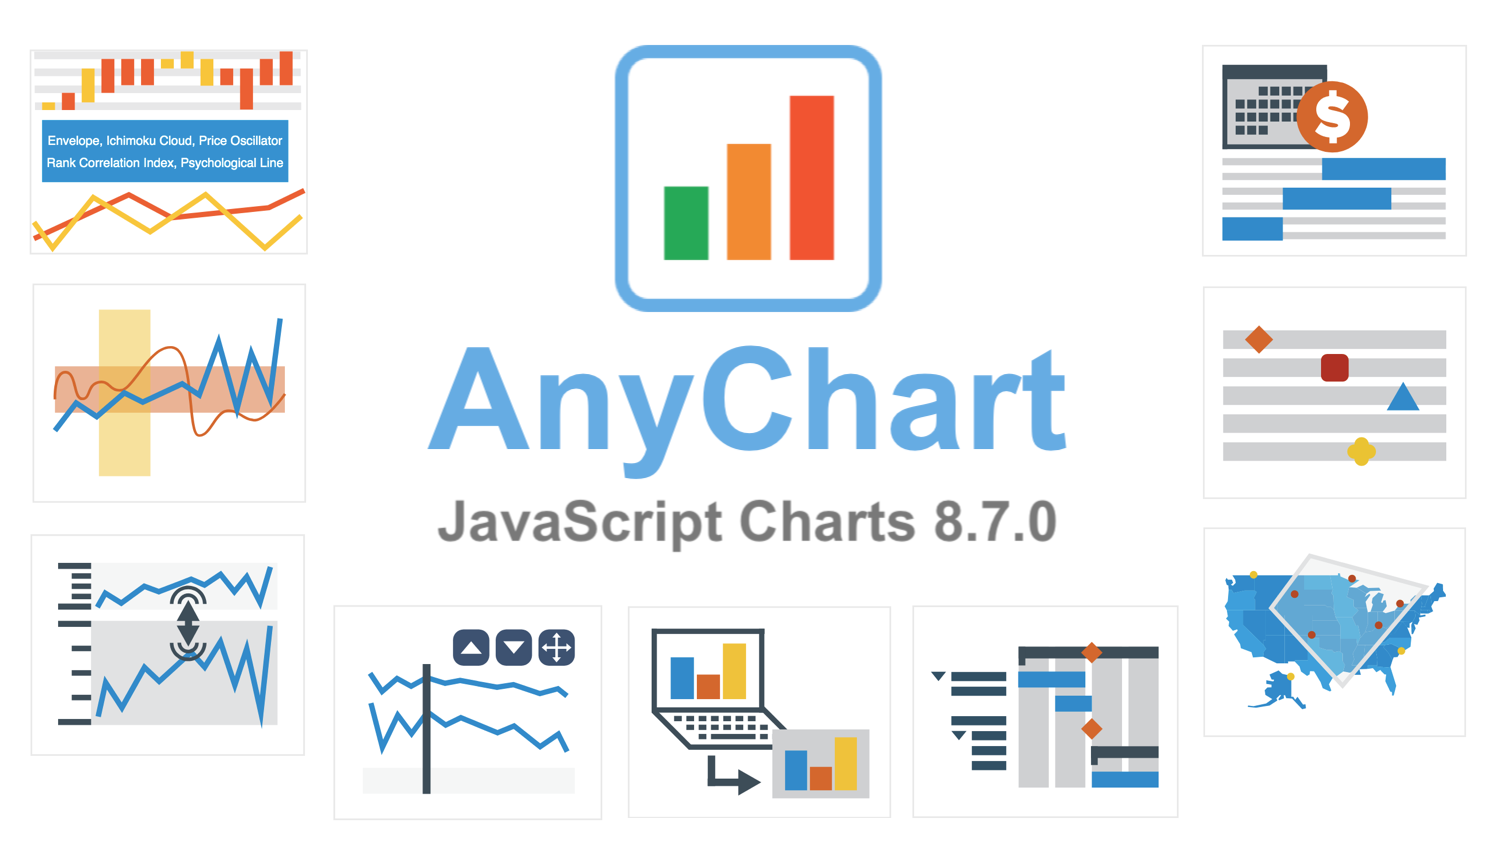 AnyChart 8.7.0 is out with a lot of new awesome data visualization features. Look what we’ve added to our JavaScript graph libraries in this major update.
»»» See What’s New in AnyChart 8.7.0! «««
- Categories: AnyChart Charting Component, AnyGantt, AnyMap, AnyStock, Big Data, Business Intelligence, Financial Charts, Gantt Chart, HTML5, JavaScript, News, Stock Charts
- 4 Comments »
AnyChart Joins Qlik Technology Program and Adds 36 Chart Types to Qlik Sense in Just-Launched Extensions
May 7th, 2019 by AnyChart Team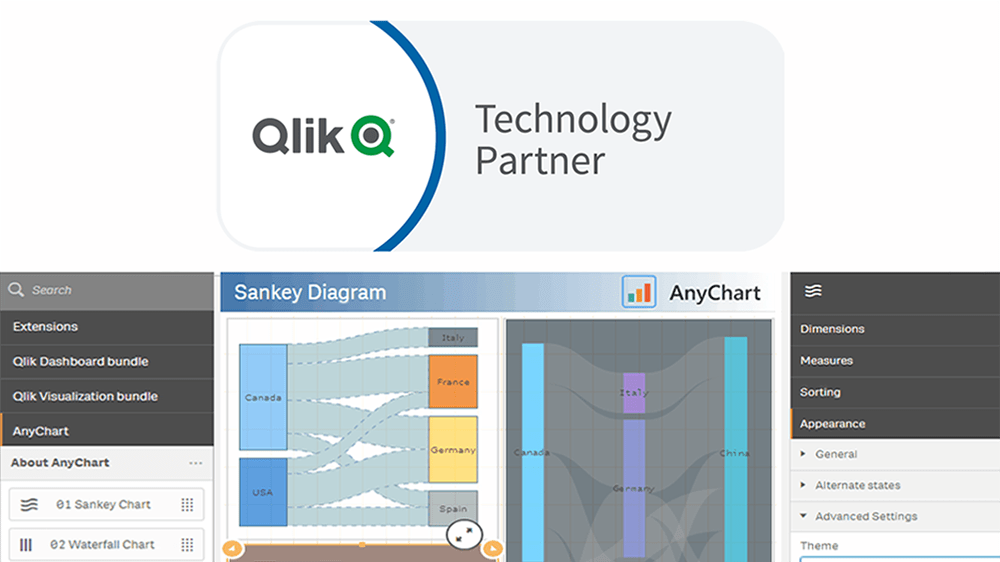
“We’re excited to be partnering with AnyChart, and their extensions will provide customers with additional choices for building even more compelling visualizations.”
— Mike Foster, Vice President, Strategic Partners at Qlik.
(Source: press release as of May 7, 2019.)
AnyChart crosses a new frontier! The vast data visualization capabilities of our award-winning JavaScript charting library, designed primarily for web developers and software engineers, are now available directly to data analysts and BI experts through powerful, flexible, intuitive extensions for Qlik Sense — AnyChart, AnyGantt, and AnyStock!
Read more at qlik.anychart.com »
- Categories: AnyChart Charting Component, AnyGantt, AnyStock, Big Data, Business Intelligence, Qlik
- 13 Comments »
FinancesOnline Honors AnyChart Data Visualization Software with Premium Usability and Rising Star Awards
April 23rd, 2019 by AnyChart Team At AnyChart, we believe that companies and organizations should be able to leverage their data without having to waste time on trying to make sense of raw digits and vast spreadsheets. This is why we worked hard to create a no-fuss interactive data visualization software that does not compromise flexibility while giving everyone a unique chance to visualize any data in any way they want and make correct data-driven decisions they need in an instant. It is for this reason that FinancesOnline, a reputable business directory, has included our charting solution in their list of the top data visualization tools and granted us the Premium Usability Award and the Rising Star Award for 2019!
- Categories: AnyChart Charting Component, News
- No Comments »
What Is Data Visualization? Definition, History, and Examples
November 20th, 2018 by Jay Stevenson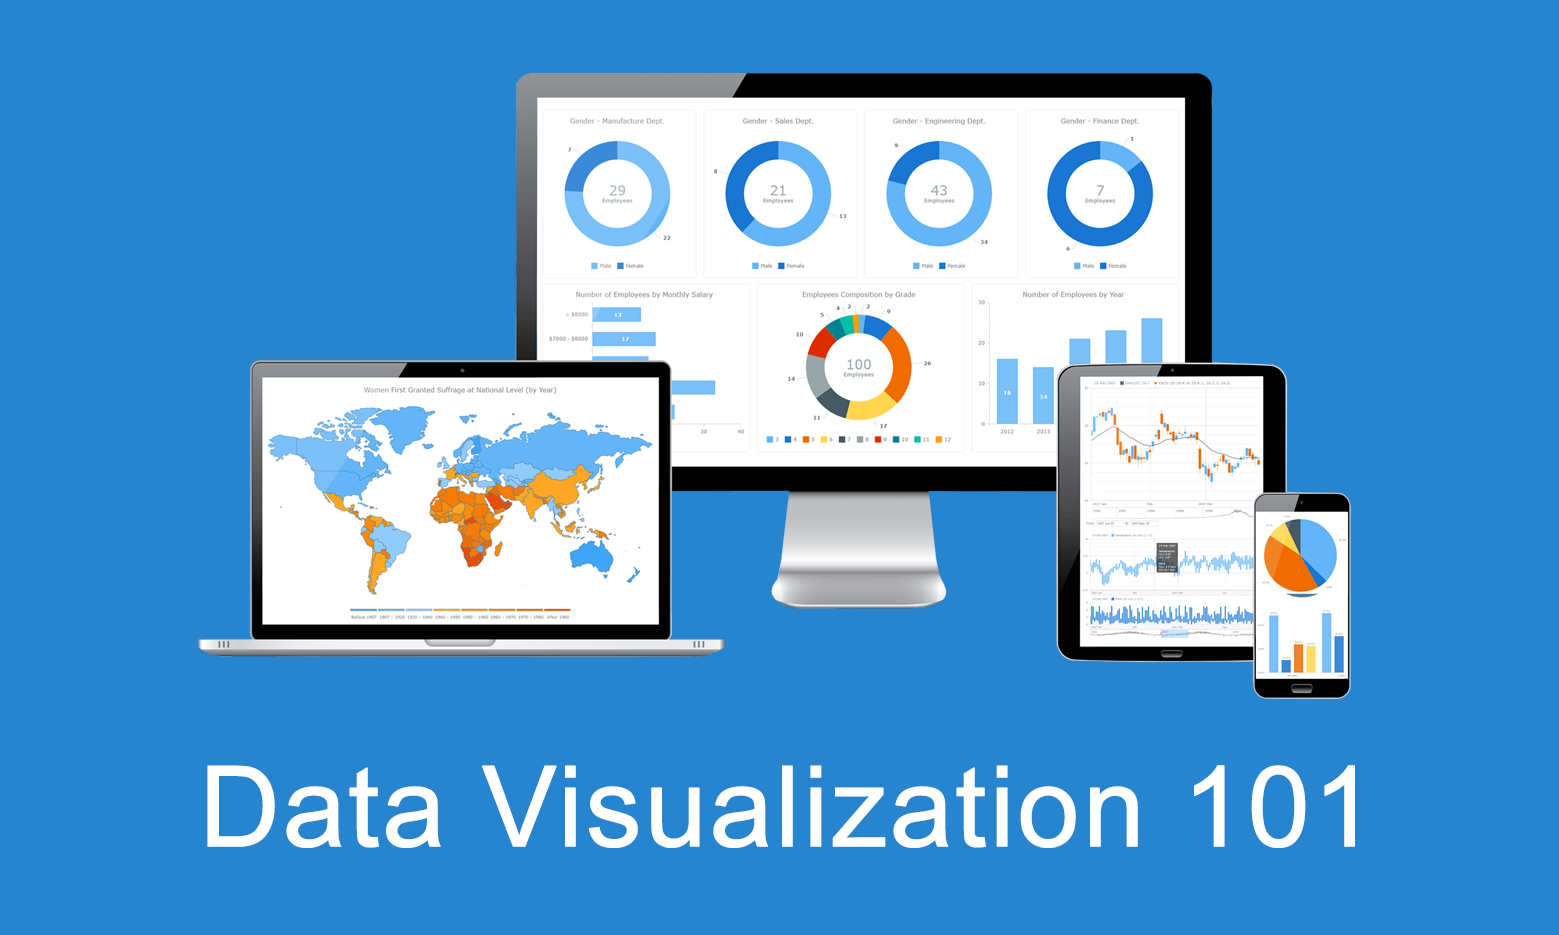 Data visualization is the practice of converting data from raw figures into a graphical representation such as graphs, maps, charts, and complex dashboards. Let’s see what makes it important (meaning), how it has developed (history), and exactly how it can work in real life (examples). Join us on Data Visualization 101, an introduction to dataviz and its power.
Current Price Indicator with Custom Value and Scale Calculation in JavaScript Stock Charts — Challenge AnyChart!
September 19th, 2018 by Irina Maximova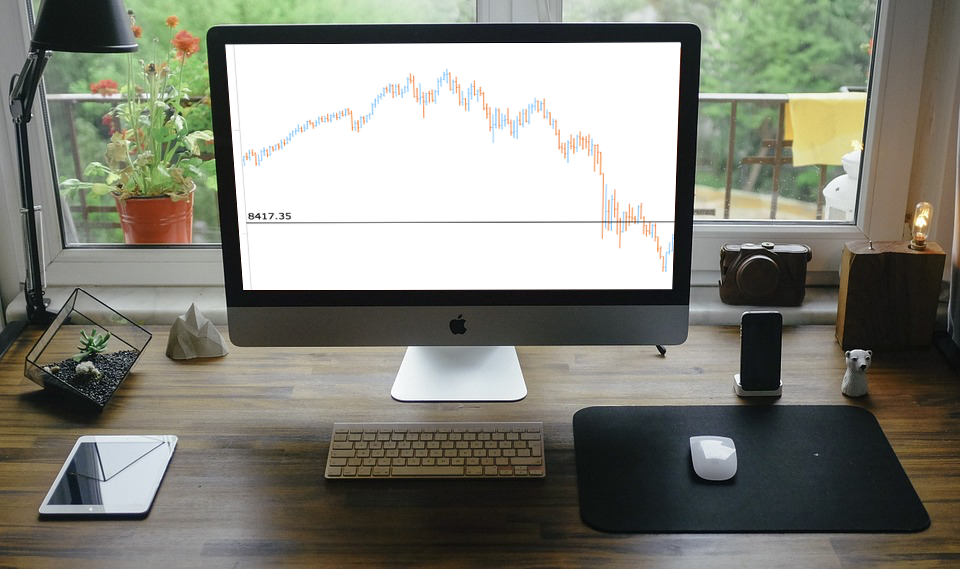 Further inspired by noteworthy questions our Support Team receives from customers, we resume the Challenge AnyChart! feature, demonstrating huge flexibility of our JavaScript (HTML5) charting libraries and explaining how exactly you can solve advanced data visualization tasks with the help of AnyChart. Today’s tutorial is about JS stock charts, and more precisely, we’ll dive into how to draw the Current Price Indicator with a custom value and make it visible even when zooming and scrolling, by utilizing Axis Markers.
- Categories: AnyChart Charting Component, AnyStock, Big Data, Business Intelligence, Challenge AnyChart!, Charts and Art, Financial Charts, HTML5, JavaScript, Stock Charts, Tips and Tricks
- No Comments »
Custom Technical Indicators in JavaScript Stock Charts — Challenge AnyChart!
March 14th, 2018 by Irina Maximova
It is a pleasure to present a new Challenge AnyChart article! We love our customers and their original tasks, so we continue to show the unlimited capabilities of our JavaScript charting libraries to the blog readers.
The heroes of today’s tutorial are custom technical indicators. Below we’ll explore how to add them to a JS (HTML5) stock chart step by step. So, let’s begin.
- Categories: AnyChart Charting Component, AnyStock, Big Data, Business Intelligence, Challenge AnyChart!, Charts and Art, Financial Charts, HTML5, JavaScript, Stock Charts, Tips and Tricks
- 1 Comment »