 AnyChart 8.7.0 is out with a lot of new awesome data visualization features. Look what we’ve added to our JavaScript graph libraries in this major update.
New Features in AnyChart 8.7.0
 |
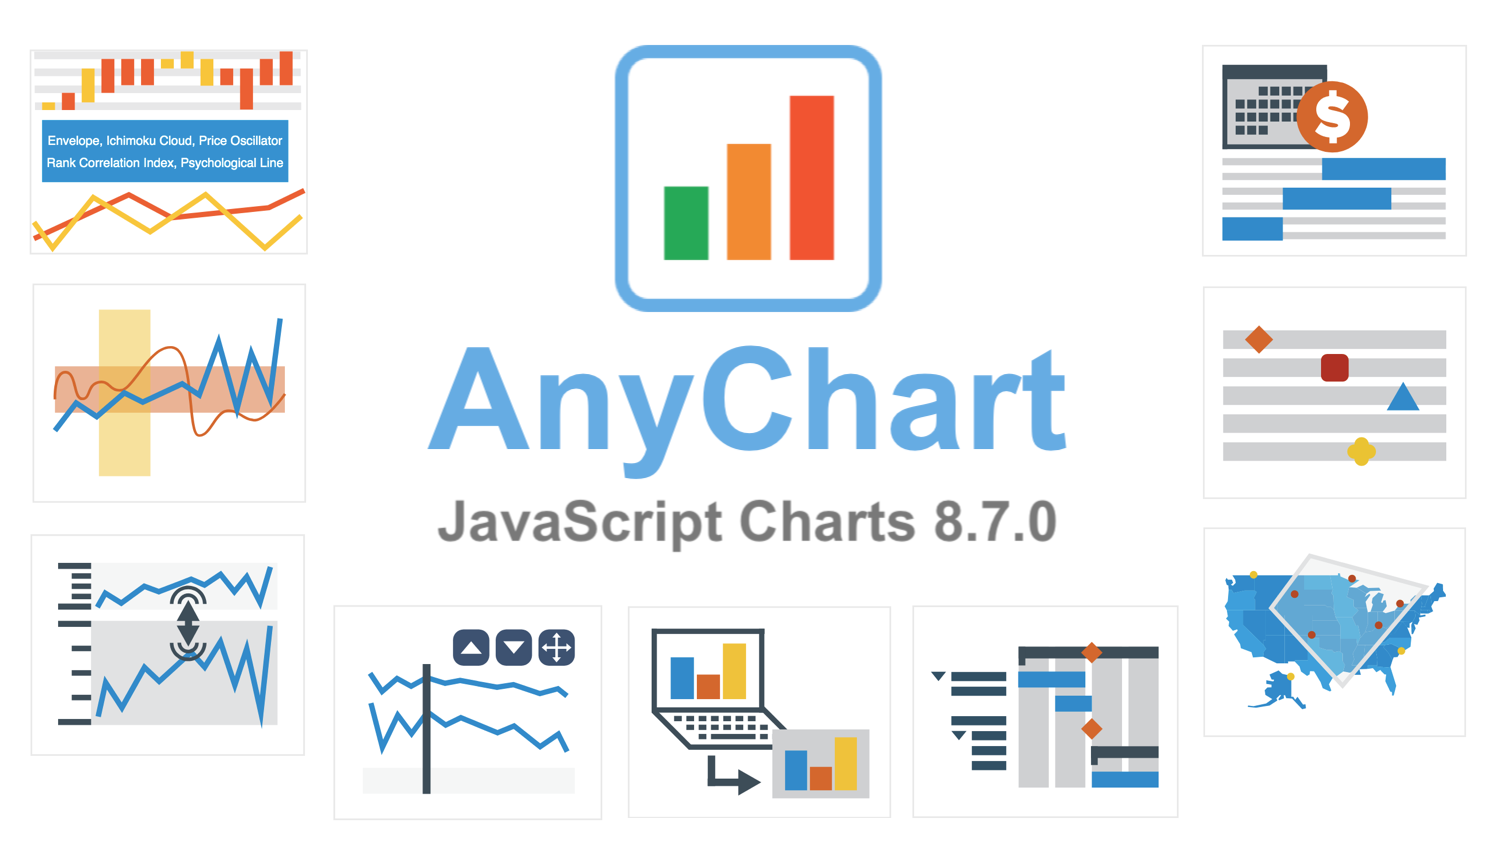
Client-Side ExportWe’ve added the client-side export feature to all our JavaScript charting libraries — AnyChart, AnyStock, AnyGantt, and AnyMap. This will allow you to have your data visualizations saved as images — SVG, PNG, and JPG — and PDF documents without a roundtrip to the server, by leveraging the built-in browser features for a seamless JS chart export, fast and secure. |
 |
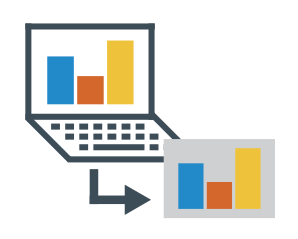
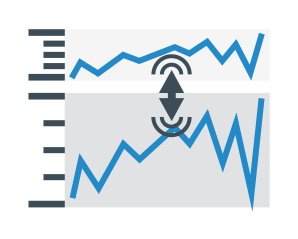
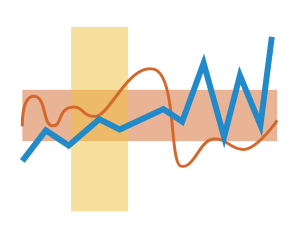
Stock UI Controls: Swap and MaximizeThe AnyStock JS library is now provided with three new UI controls in the form of buttons — “Up,” “Down,” and “Maximize.” The buttons make it easy for the viewer, market data analyst or trader, to swap the adjoining stock charts by moving one of them up or down, or maximize a certain visualization so it fills the entire page. |
 |
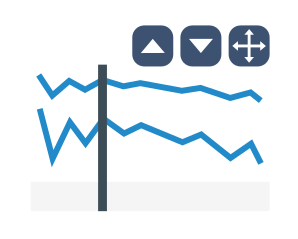
Stock Plot SplitterA splitter is now automatically created between stock chart plots. It enables the viewer to change the relative height of the charts by dragging them up or down. This feature can facilitate data analysis when multiple stock or financial charts are drawn on the same page one above the other, allowing the viewer to make a (currently) more important visualization bigger than the others. |
 |
Infinite Range AnnotationsIn release 8.7.0, we’ve also delivered two new annotations to the AnyStock JavaScript graph library. These are infinite ranges — horizontal and vertical. So now they can be drawn on stock and financial charts powered by AnyStock using a ready-to-use UI, allowing you to avoid coding them as range axis markers, and therefore to save you a lot of time and effort. In our gallery, you’ll find two examples of how these annotations can look — horizontal range demo and vertical range demo. |
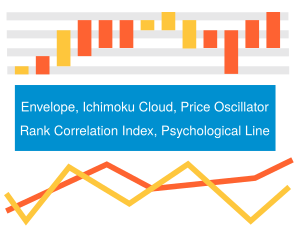 |
New Technical IndicatorsFive new out-of-the-box indicators for technical analysis are now available in stock charts: Envelope (ENV), Ichimoku Cloud (IKH), Price Oscillator (PPO), Rank Correlation Index (RCI), and Psychological Line (PSY). You’ll find stock chart examples showcasing these and other technical indicators in a special section of our gallery. |
 |
Milestone Preview on Parent Task BarMilestone preview on the parent task bar is now available in the AnyGantt library. This new feature will allow the viewer of a Gantt chart to quickly understand what milestones such a task has and then expand it to learn the details if needed. Check out an example of a Gantt chart with milestone preview in our gallery. |
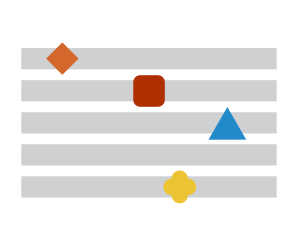 |
Custom Marker for MilestoneIn release 8.7.0, we’ve also added an option to customize milestone markers on Gantt charts by type and color. So now you can easily differentiate between the milestones of non-identical nature within the same project by depicting them in different ways. Look at a Gantt chart example with custom markers in our gallery. |
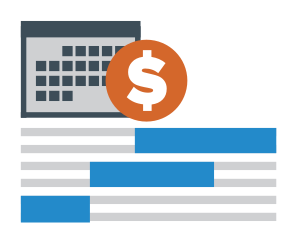 |
Custom Basic YearPreviously, our Gantt charts only supported the calendar year as the basic year period. Now, it is possible to define a custom one. For example, you can go ahead and set a fiscal (financial) year, or an academic year, or any other year depending on what point of reference you actually need in this regard; quarters will be formed accordingly. Here’s a fiscal year demo. |
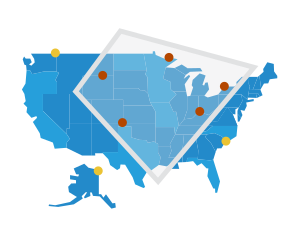 |
Polygonal Selection in MapsWe’ve made it possible to select points on JS map charts powered by the AnyMap library by drawing a polygon. In addition to the rectangular marquee, such a complex, polygonal selection can now be easily configured using our API and is also available to the end user from the context menu. Give it a try on a dedicated selection type demo in our gallery. |
More JavaScript Graph Visualization Improvements in Version 8.7.0
In fact, release 8.7.0 has delivered even more improvements as well as bug fixes.
Check out the version histories of our products for more information:
The next major update of our JavaScript graph visualization libraries will bring multiple other improvements. In the meantime, feel free to send us new feature requests along with any other suggestions — just get in touch with our Support Team, and we’d love to hear from you exactly what you want to get.
Enjoy AnyChart JS Charts 8.7.0!
- Categories: AnyChart Charting Component, AnyGantt, AnyMap, AnyStock, Big Data, Business Intelligence, Financial Charts, Gantt Chart, HTML5, JavaScript, News, Stock Charts
- 4 Comments »
Comments (4)
Hello, I love your charts, your charts its amazing, but I’d like to know if will you update how to integrate anychart with python/django?
Hello, thank you! We already have integration templates for all major stacks including one for Python + Django. Hope it helps. If you need further assistance, please do not hesitate to contact our amazing Support Team.
need linear regression projections
Thanks for your suggestion. We’ll think of adding this to the component in the future.
In the meantime, check out the article “Regression Analysis in AnyChart JavaScript Charts.” Basically, you can connect anything you want.