 Do you have trading data, looking for a way to effectively visualize it for your website or app project? If so, a JS candlestick chart could be your best pick. This tutorial will break down the process needed to create such a chart into simple steps and provide a detailed explanation of the code. Keep reading even if you are new to programming, because only a basic understanding is needed to follow along and master such a JavaScript (HTML5) based data visualization technique.
Also called a Japanese candlestick chart, this chart type is one of the most popular forms of financial and stock data visualization. Each candlestick represents information about the open, high, low, and close price of the day. Candlestick charts are widely used in technical analysis of price movement patterns.
Complete this tutorial and you will be able to create a compelling interactive candlestick chart in JavaScript real quick, with ease.
How to Create JavaScript Candlestick Chart
When it comes to JavaScript charting, there are four basic steps usually needed to make a data visualization of almost any type:
- Create the HTML page where the chart will be displayed.
- Include all necessary JavaScript files.
- Prepare the data you want to visualize.
- Write the JS code for the chart.
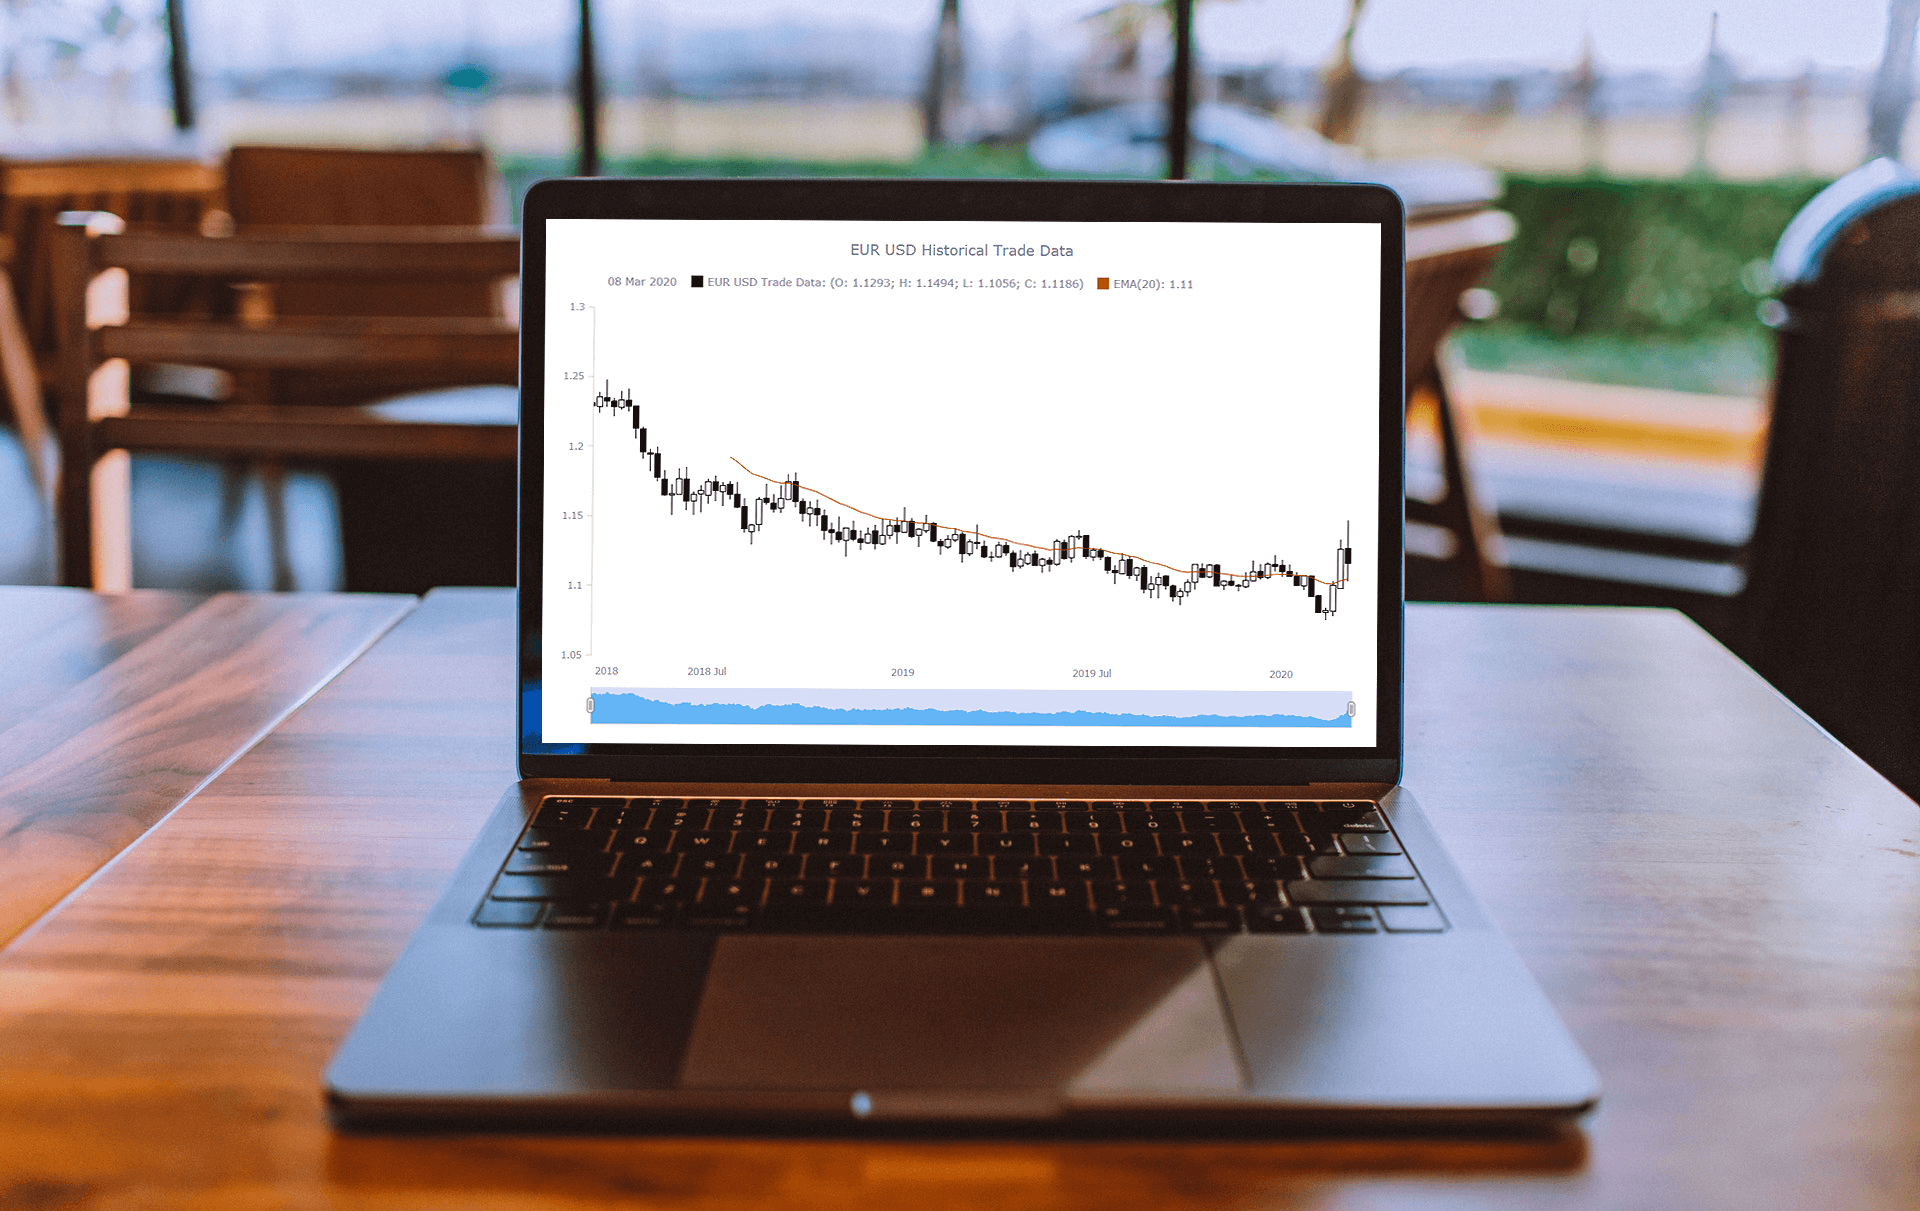
The tutorial includes four JS candlestick chart examples. Here’s how the final one will look (just so you could better imagine where we are going):
Now, each step will be explained in detail.
Step 1: Create an HTML page
First of all, you need to create a basic HTML page. Include a relevant title and an HTML block element (for example, <div>) to place the chart. Here, the id used has the value container. But feel free to use whatever makes sense to you.
The page should look as follows:
<!DOCTYPE html>
<html>

<head>
  <title>JavaScript Candlestick Chart</title>
  <style>
    html,
    body,
    #container {
      width: 100%;
      height: 100%;
      margin: 0;
      padding: 0;
    }
  </style>
</head>

<body>
  <div id="container"></div>
</body>

</html>
Note that you can specify the width and height parameters inside the <style> block to modify the space that your chart will occupy. I have put 100% in both parameters and thus the chart will fill the whole page.
Step 2. Include all necessary JS files
Second, reference all the necessary script files in the <head> section.
There are many JavaScript charting libraries out there with ready-made features that are of great help when you want to quickly create a visualization — sometimes even complex one — which would otherwise require advanced coding experience.
In this tutorial, I will make use of AnyChart, and to be more accurate, of AnyChart’s AnyStock JS library specifically made for visualizing large datasets of date and time based charts including (but actually not limited to) stock charts.
You can either reference the necessary scripts from the CDN or download them for local use.
Let’s use the CDN links. For stock candlesticks, you need to use both the anychart-core.min.js and anychart-stock.min.js scripts. Here’s how it looks in the HTML code:
<!DOCTYPE html>
<html>

<head>
  <title>JavaScript Candlestick Chart</title>
  <script src="https://cdn.anychart.com/releases/8.7.1/js/anychart-core.min.js" type="text/javascript"></script>
  <script src="https://cdn.anychart.com/releases/8.7.1/js/anychart-stock.min.js" type="text/javascript"></script>
  <style>
    html,
    body,
    #container {
      width: 100%;
      height: 100%;
      margin: 0;
      padding: 0;
    }
  </style>
</head>

<body>
  <div id="container"></div>
  <script>
    // The candlestick code will be written here
  </script>
</body>

</html>
Note that there is a script tag in the <body> section. That’s where I will put all the code for the JS candlestick chart.
Step 3: Prepare the data
Load the data
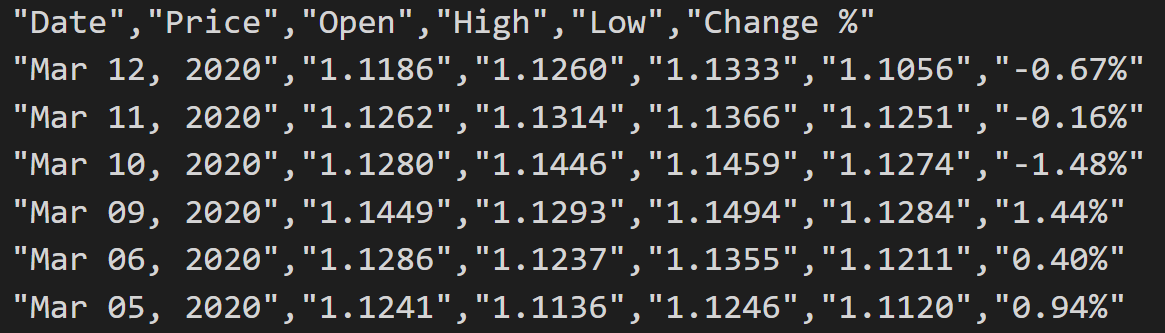
For this candlestick chart, I chose to visualize historical data for EUR/USD (euro/U.S. dollar) from Investing.com, focusing on the time period of two years, March 2018 to March 2020. Since the dataset is pretty large, instead of inserting the data directly in the .html file, let’s put it in a CSV file for convenience.
Here’s a sample to demonstrate how the data looks:
AnyChart has a module called Data Adapter that allows developers to load CSV and other file formats in a quite straightforward way. Go ahead and reference this module in the <head> section:
<!DOCTYPE html>
<html>

<head>
  <title>JavaScript Candlestick Chart</title>
  <script src="https://cdn.anychart.com/releases/8.7.1/js/anychart-core.min.js" type="text/javascript"></script>
  <script src="https://cdn.anychart.com/releases/8.7.1/js/anychart-stock.min.js" type="text/javascript"></script>
  <script src="https://cdn.anychart.com/releases/8.7.1/js/anychart-data-adapter.min.js"></script>

  <style>
    html,
    body,
    #container {
      width: 100%;
      height: 100%;
      margin: 0;
      padding: 0;
    }
  </style>
</head>

<body>
  <div id="container"></div>
  <script>
    // The candlestick code will be written here
  </script>
</body>

</html>
Next, using the loadCsvFile() method provided by the Data Adapter, load the data. And then create a data table to apply this data to the chart. The code implementation looks as follows:
anychart.data.loadCsvFile("https://static.anychart.com/git-storage/word-press/data/candlestick-chart-tutorial/EUR_USDHistoricalData2year.csv", function (data) {

  var dataTable = anychart.data.table(0, 'MMM d, yyyy');
  dataTable.addData(data);

});
Map the data
Now that the data is loaded, let’s use the mapAs() function to transform the data fields into the fields of the candlestick chart.
We need five data fields:
x, which usually represents the dateopen, which represents the price at the start periodhigh, which represents the highest price during this periodlow, which represents the lowest price during this period, andclose, which represents the price at the end, or close, of the period
In the CSV file, you see that in our case open is the second field, high the third, low the fourth, and close the first. So here’s what you should write:
var mapping = dataTable.mapAs({ 'open': 2, 'high': 3, 'low': 4, 'close': 1 });Step 4: Write the JS candlestick chart code
Now that everything is set up, proceed to the chart code itself.
All the coding will take place inside the <script> tag. The first function that needs to be added there is the anychart.onDocumentReady. It will enclose all the code and will be executed when the page is ready:
<script>
  anychart.onDocumentReady(function () {
    // The candlestick code will be written here
  });
</script>
Next, include the data from step 3:
<script>
  anychart.onDocumentReady(function () {

    // load data
    anychart.data.loadCsvFile("https://static.anychart.com/git-storage/word-press/data/candlestick-chart-tutorial/EUR_USDHistoricalData2year.csv", function (data) {

      // create a data table
      var dataTable = anychart.data.table(0, 'MMM d, yyyy');
      dataTable.addData(data);

      // map data
      var mapping = dataTable.mapAs({ 'open': 2, 'high': 3, 'low': 4, 'close': 1 });

    });

  });
</script>
Finally, use anychart.stock() to create a stock chart and provide it with the candlestick series. Then you can specify an appropriate chart title, put the chart into the container, and command to draw it.
Done! You’ve just made your first interactive candlestick chart in HTML5 using JavaScript!
In the resulting JS candlestick chart, it is possible to observe how the EUR/USD currency pair traded over two years. Use the scroller to zoom into a shorter period if you want. Tooltips and crosshairs show up on hover.
With only the default settings, you have got a fully functional and interactive chart that finely presents all the basic information needed for financial analysts and traders to do their job.
By the way, AnyChart has its own online editor for data visualizations like charts, maps, and dashboards, called AnyChart Playground. This candlestick chart is available right there so you can play with its code in a convenient way.
Here’s the full code of the chart:
<!DOCTYPE html>
<html>

<head>
  <title>JavaScript Candlestick Chart</title>
  <script src="https://cdn.anychart.com/releases/8.7.1/js/anychart-core.min.js" type="text/javascript"></script>
  <script src="https://cdn.anychart.com/releases/8.7.1/js/anychart-stock.min.js" type="text/javascript"></script>
  <script src="https://cdn.anychart.com/releases/8.7.1/js/anychart-data-adapter.min.js"></script>
  <style>
    html,
    body,
    #container {
      width: 100%;
      height: 100%;
      margin: 0;
      padding: 0;
    }
  </style>
</head>

<body>
  <div id="container"></div>
  <script>
    anychart.onDocumentReady(function () {

      // load data
      anychart.data.loadCsvFile("https://static.anychart.com/git-storage/word-press/data/candlestick-chart-tutorial/EUR_USDHistoricalData2year.csv", function (data) {

        // create a data table
        var dataTable = anychart.data.table(0, 'MMM d, yyyy');
        dataTable.addData(data);

        // map data
        var mapping = dataTable.mapAs({ 'open': 2, 'high': 3, 'low': 4, 'close': 1 });

        // set the chart type
        var chart = anychart.stock();

        // set the series
        var series = chart.plot(0).candlestick(mapping);
        series.name("EUR USD Trade Data");

        // set the chart title
        chart.title("EUR USD Historical Trade Data");

        // set the container id
        chart.container('container');

        // draw the chart
        chart.draw();

      });

    });
  </script>
</body>

</html>
JS Candlestick Chart Customization
So you’ve build a basic candlestick chart in JS, with predefined styles and features. However, there are numerous things you can easily change if you need to.
Now, I will show you how to customize it in the following ways:
- Add the EMA indicator for technical analysis.
- Modify the candlestick colors.
- Configure the scroller series.
Add the EMA technical indicator
EMA stands for Exponential Moving Average. Based on mathematical formulas to place greater weight and importance to recent observations, it is a technical indicator widely used in financial charts to analyze data. Depending on a situation, traders may like to use different EMA periods. For example, 20-day, 30-day and 90-day moving averages.
AnyStock already has the code needed for adding EMA. So you can simply insert it in your candlestick chart and specify the period you want to use. Like this:
// create a plot
var plot = chart.plot(0);
// create an EMA indicator with period 20
var ema20 = plot.ema(mapping, 20).series();
// set the EMA color
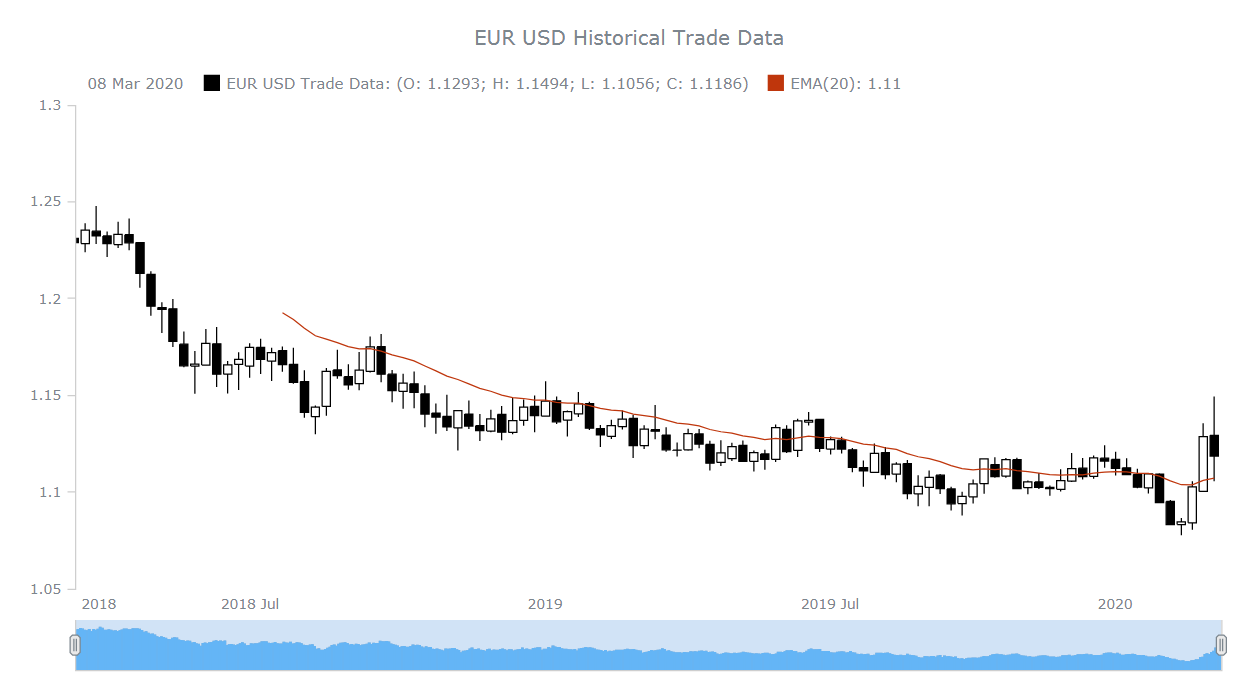
ema20.stroke('#bf360c');Here’s the result:
Modify the candlestick colors
If you want to encode increases and decreases of the price using white and black colors, simply add the following lines:
// modify the color of candlesticks making them black and white
series.fallingFill("black");
series.fallingStroke("black");
series.risingFill("white");
series.risingStroke("black");
Here’s the result:
Configure the scroller series
Currently, the date is displayed both on the default X-axis and the scroller. You can disable the extra X-axis as follows:
chart.scroller().xAxis(false);Now, let’s plot the open value as a column series in the scroller. First, create a variable to store open values only:
openValue = dataTable.mapAs();
openValue.addField('value', 2);
Second, in just one line of code, create a scroller series with the mapped data:
chart.scroller().column(openValue);Look at the result:
For your convenience, here’s the full code of this final JS candlestick chart:
<!DOCTYPE html>
<html>

<head>
  <title>JavaScript Candlestick Chart</title>
  <script src="https://cdn.anychart.com/releases/8.7.1/js/anychart-core.min.js" type="text/javascript"></script>
  <script src="https://cdn.anychart.com/releases/8.7.1/js/anychart-stock.min.js" type="text/javascript"></script>
  <script src="https://cdn.anychart.com/releases/8.7.1/js/anychart-data-adapter.min.js"></script>
  <style>
    html,
    body,
    #container {
      width: 100%;
      height: 100%;
      margin: 0;
      padding: 0;
    }
  </style>
</head>

<body>
  <div id="container"></div>
  <script>
    anychart.onDocumentReady(function () {

      // load data
      anychart.data.loadCsvFile("https://static.anychart.com/git-storage/word-press/data/candlestick-chart-tutorial/EUR_USDHistoricalData2year.csv", function (data) {

        // create a data table
        var dataTable = anychart.data.table(0, 'MMM d, yyyy');
        dataTable.addData(data);

        // map data
        var mapping = dataTable.mapAs({ 'open': 2, 'high': 3, 'low': 4, 'close': 1 });

        // set the chart type
        var chart = anychart.stock();

        // set the series
        var series = chart.plot(0).candlestick(mapping);
        series.name("EUR USD Trade Data");

        // set the chart title
        chart.title("EUR USD Historical Trade Data");

        // create a plot
        var plot = chart.plot(0);
        // create an EMA indicator with period 20
        var ema20 = plot.ema(mapping, 20).series();
        // set the EMA color
        ema20.stroke('#bf360c');

        // disable the scroller axis
        chart.scroller().xAxis(false);
        // map "open" values for the scroller
        openValue = dataTable.mapAs();
        openValue.addField('value', 2);
        // create a scroller series with the mapped data
        chart.scroller().column(openValue);

        // modify the color of candlesticks making them black and white
        series.fallingFill("black");
        series.fallingStroke("black");
        series.risingFill("white");
        series.risingStroke("black");

        // set the container id
        chart.container('container');

        // draw the chart
        chart.draw();

      });

    });
  </script>
</body>

</html>
Conclusion
Creating interactive charts for apps and sites with the help of dedicated JavaScript libraries for data visualization is not complicated at all, is it? Actually, even newbies to coding can create professional-looking interactive charts that meet their needs.
In this tutorial, I tried to show four simple steps needed to make your own first JS candlestick chart and hope it is helpful.
To learn more about creating and customizing candlestick charts, see the candlestick chart documentation.
- Categories: AnyChart Charting Component, AnyStock, Big Data, Financial Charts, HTML5, JavaScript, JavaScript Chart Tutorials, Stock Charts, Tips and Tricks
- No Comments »