Visualization Techniques in Action, Unveiling Insight into Mueller Investigation, Partisan Bias, Light Pollution, and Women in Politics — DataViz Weekly
March 22nd, 2019 by AnyChart Team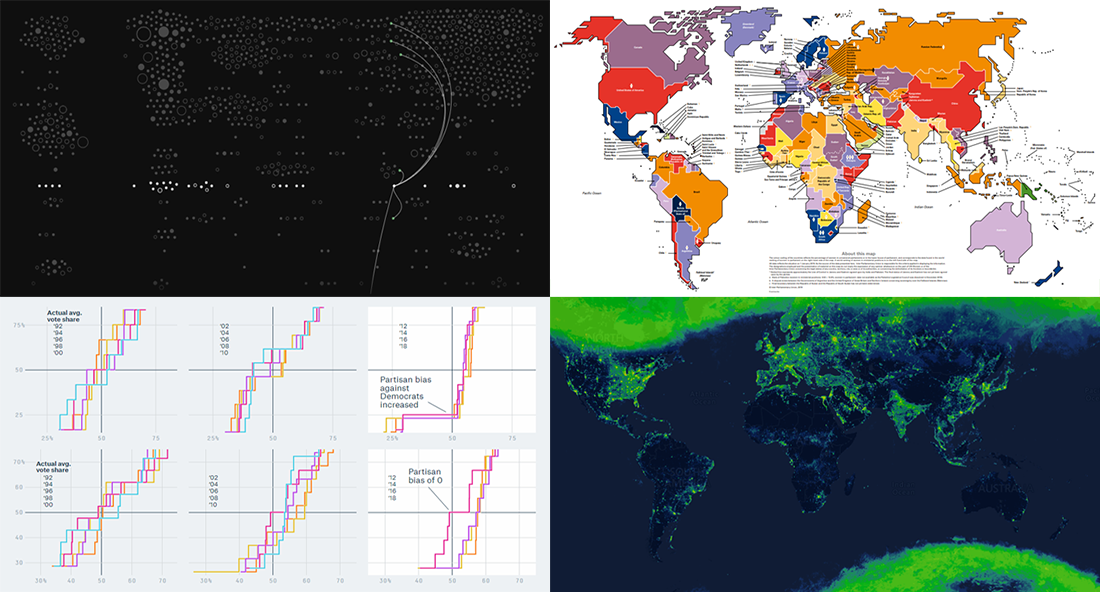 Data visualization techniques help us people analyze and communicate data in a much more convenient and effective manner than raw digits or spreadsheets. We’ve been proving this for years by publishing DataViz Weekly, our regular blog feature in which we show you some of the best new data graphics-based projects from all over the web.
This week, we’ve run across and decided to highlight new interesting charts on the following subjects:
- connections in the Mueller investigation;
- partisan bias as a metric to reveal a partisan gerrymander;
- light pollution;
- women in politics.
Look at these nice examples of data visualization in action.
- Categories: Data Visualization Weekly
- No Comments »
New Interesting Data Visualizations on NBA, Spending, and Gender Pay Gap — DataViz Weekly
March 15th, 2019 by AnyChart Team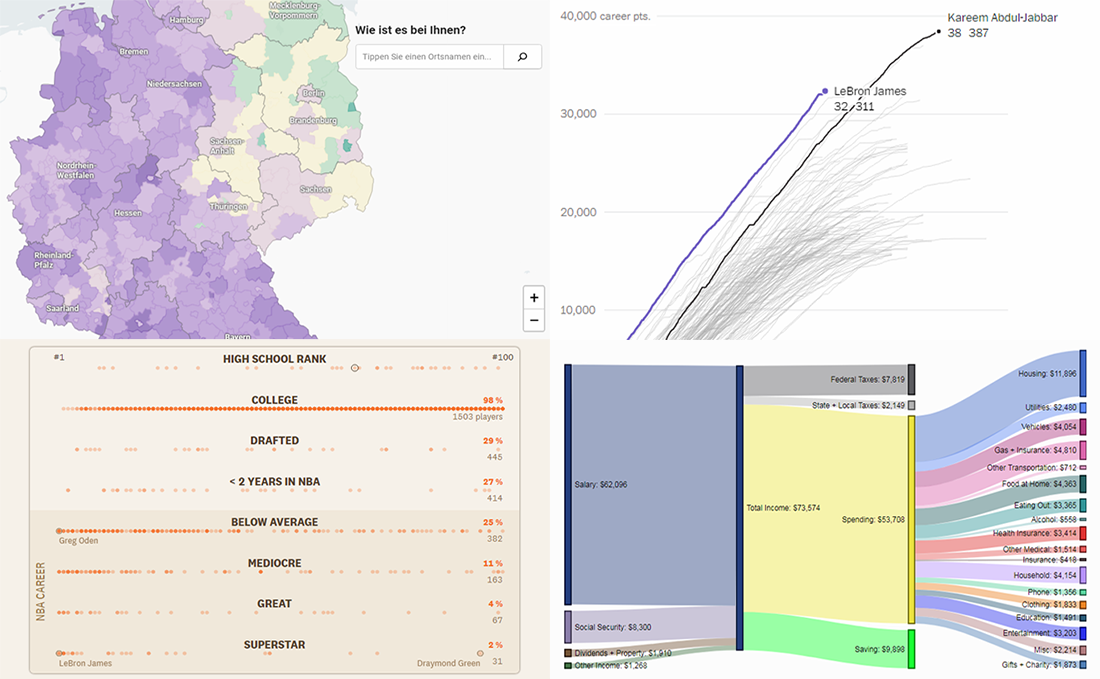 Continuing the regular DataViz Weekly feature on the AnyChart blog, today we are happy to tell you about new interesting data visualizations we’ve found these days — wonderful examples of charts designed for visual storytelling and analytics:
- gender pay gap in Germany;
- NBA’s all-time scoring leaders, now with LeBron James in top 4;
- from leading high school basketball players to NBA superstars;
- household spending in the United States, by income group.
- Categories: Data Visualization Weekly
- No Comments »
Chart Visualization Examples Showing Data About Snow, Prejudice, Names, and Prosperity — DataViz Weekly
March 8th, 2019 by AnyChart Team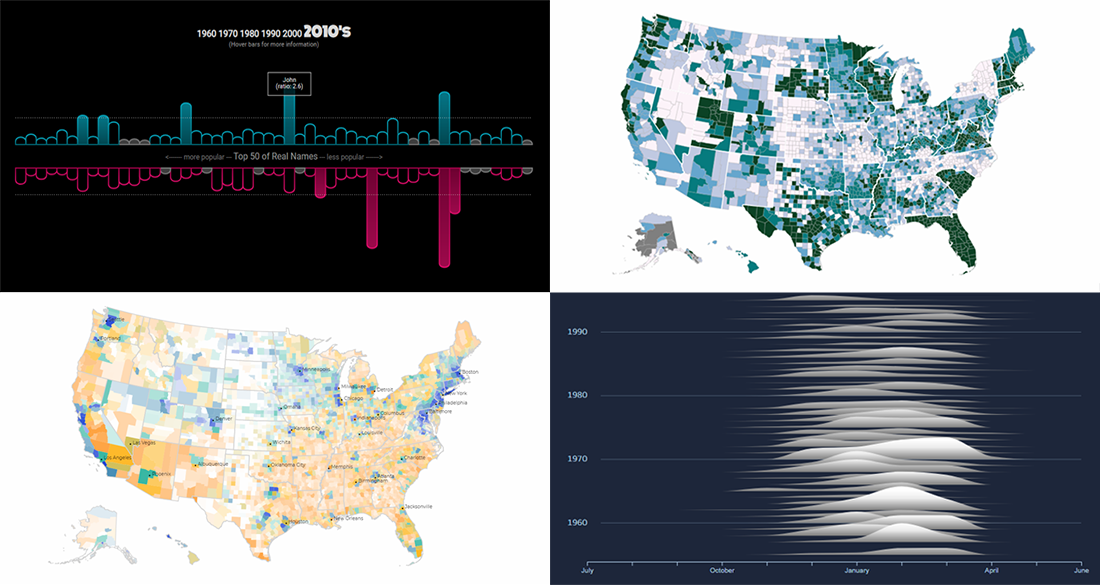 It’s Friday, and here’s another selection of cool chart visualization projects we’ve come across these days. Look at them for fun and inspiration!
Today on DataViz Weekly:
- winter weather and snow in Canada;
- partisan prejudice across the United States of America;
- names in movies and TV shows vs real life;
- prosperity in the United States, by county.
- Categories: Data Visualization Weekly
- No Comments »
New Great Data Visualization Examples on Elevation, Energy, Misspelling, and Jobs — DataViz Weekly
March 1st, 2019 by AnyChart Team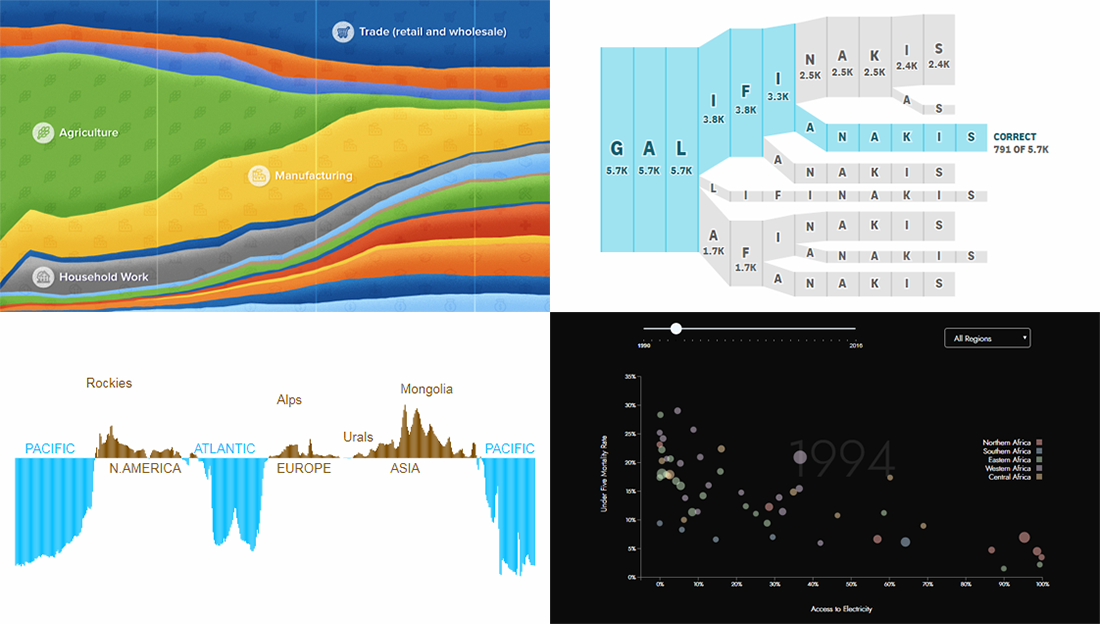 Hey everyone! Check out new great data visualization examples we’ve recently found around the web! The projects we feature today on DataViz Weekly are about Earth’s elevation and ocean depth, renewable energy in Africa, misspellings of celebrity names, and history of employment in the United States.
- Categories: Data Visualization Weekly
- No Comments »
Visualizing Statistics About Greenhouse Gases, Carbon Footprints, Movie Franchises, and Coal Production — DataViz Weekly
February 22nd, 2019 by AnyChart Team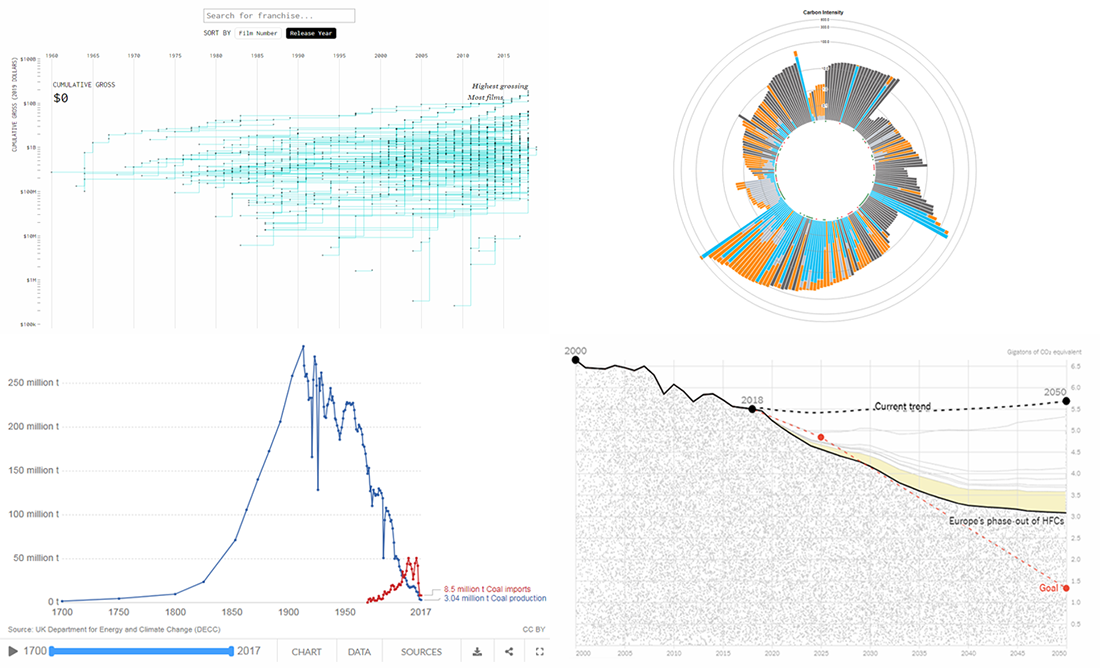 Don’t miss out on a new serving of interesting online projects visualizing statistics as we continue the DataViz Weekly series on the AnyChart blog! This time, we are glad to feature data graphics on the following subjects:
- scenarios of the greenhouse gas emissions reduction for the United States;
- carbon footprints of consumer products;
- box office revenue of movie franchises;
- rise and fall of coal production in the United Kingdom.
- Categories: Data Visualization Weekly
- No Comments »
Analyzing Trump Speech, Green Infrastructure in London, GE’s Rise and Downfall, NYC Traffic Collisions — DataViz Weekly
February 15th, 2019 by AnyChart Team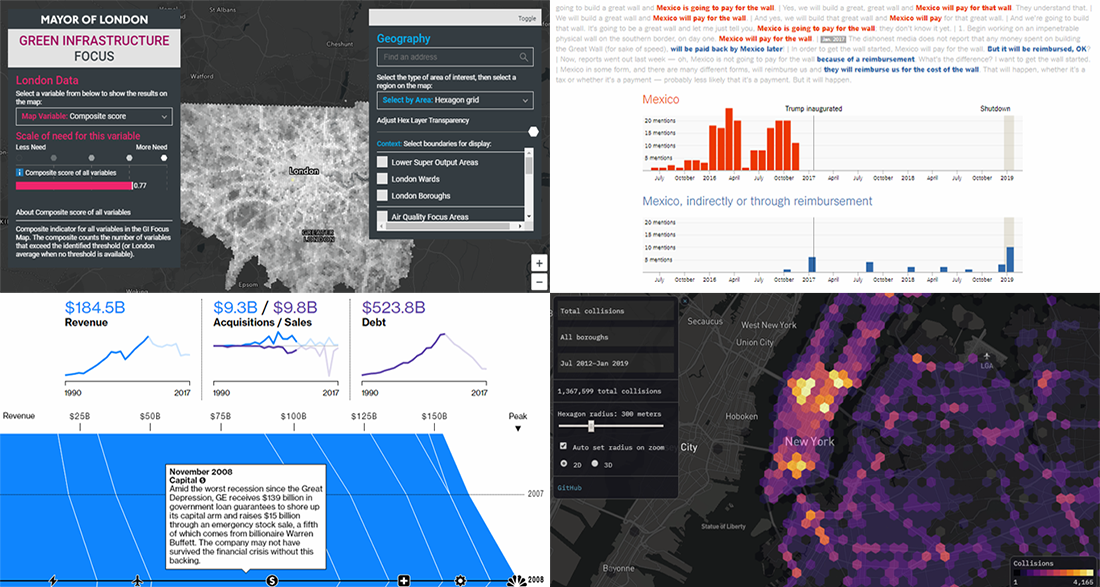 The new cool interesting data visualization projects we praise today on DataViz Weekly are helpful in analyzing Trump speech regarding the U.S.-Mexico wall, green infrastructure in London, rise and downfall of General Electrics, and traffic collisions in New York City. Take a quick look.
- Categories: Data Visualization Weekly
- No Comments »
Data Analytics and Visualization Examples Worth Seeing: High Street, Neighborhoods, Trains, Climate — DataViz Weekly
February 8th, 2019 by AnyChart Team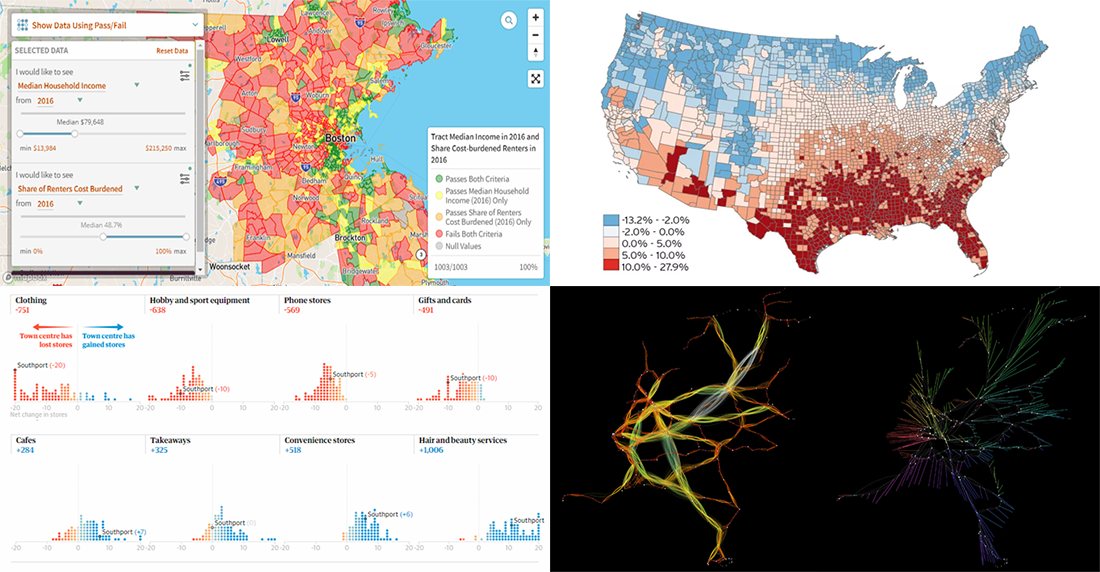 Check out new interesting data analytics and visualization examples from around the web. Here are the topics in the focus of today’s DataViz Weekly:
- high-street crisis in town centers across England and Wales;
- interactive maps of changes in Greater Boston’s neighborhoods;
- connectivity between train stations in the Netherlands;
- economic costs of climate change vs election results in the United States.
- Categories: Data Visualization Weekly
- No Comments »
Interesting Visualizations on Russia’s Borders, Paths to Congress, Child Time, News Lifespan — DataViz Weekly
February 1st, 2019 by AnyChart Team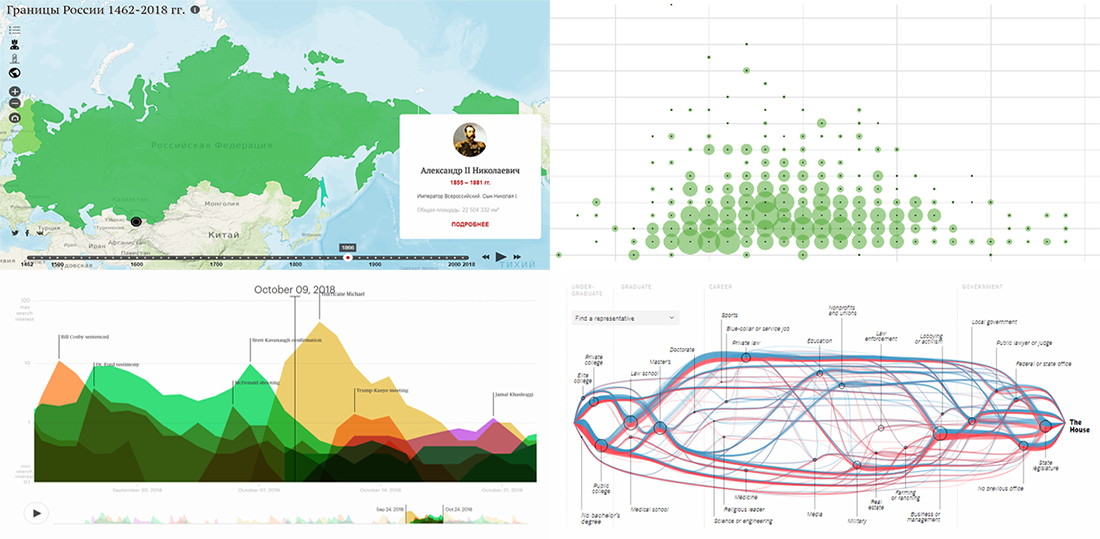 DataViz Weekly is here to meet you with some of the interesting visualizations we’ve come across these days. The new selection includes data-based projects worth seeing, with charts and infographics on the following topics:
- Russian borders from 1462 through 2018;
- career paths to the U.S. Congress;
- time to have the first child;
- lifespan of news stories.
- Categories: Data Visualization Weekly
- No Comments »
Tesla Sales, Brexit Vote, Birth Costs, Health Disparities — DataViz Weekly
January 25th, 2019 by AnyChart Team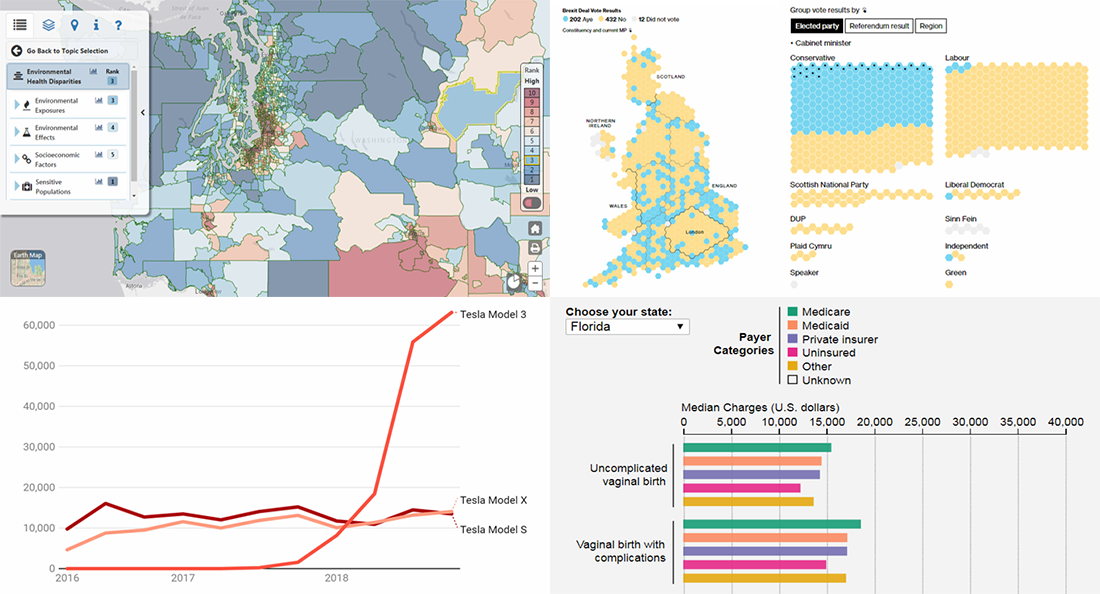 In the new DataViz Weekly post, we highlight interesting interactive data visualizations that have come to our attention this week. Take a look at charts showing details about Tesla sales, Brexit vote in the British Parliament, birth charges in American hospitals, and environmental health disparities in the Washington state.
- Categories: Data Visualization Weekly
- No Comments »
Stacked Column Charts with Images — Challenge AnyChart!
January 23rd, 2019 by Irina Maximova We are ready to share a new advanced JS (HTML5) data visualization tutorial. Tasks we get from our customers are always interesting, and the Challenge AnyChart! series on our blog proved to be a great way to show you some of the most compelling ones and explain how to solve them, demonstrating the power and flexibility of our JavaScript charts library. Today’s challenge is about adding images to stacked column charts using AnyChart.
- Categories: AnyChart Charting Component, Challenge AnyChart!, Charts and Art, HTML5, JavaScript, Tips and Tricks
- No Comments »