JavaScript Chart Libraries AnyChart, AnyGantt, AnyStock and AnyMap Receive Major 8.2.0 Update
March 27th, 2018 by AnyChart Team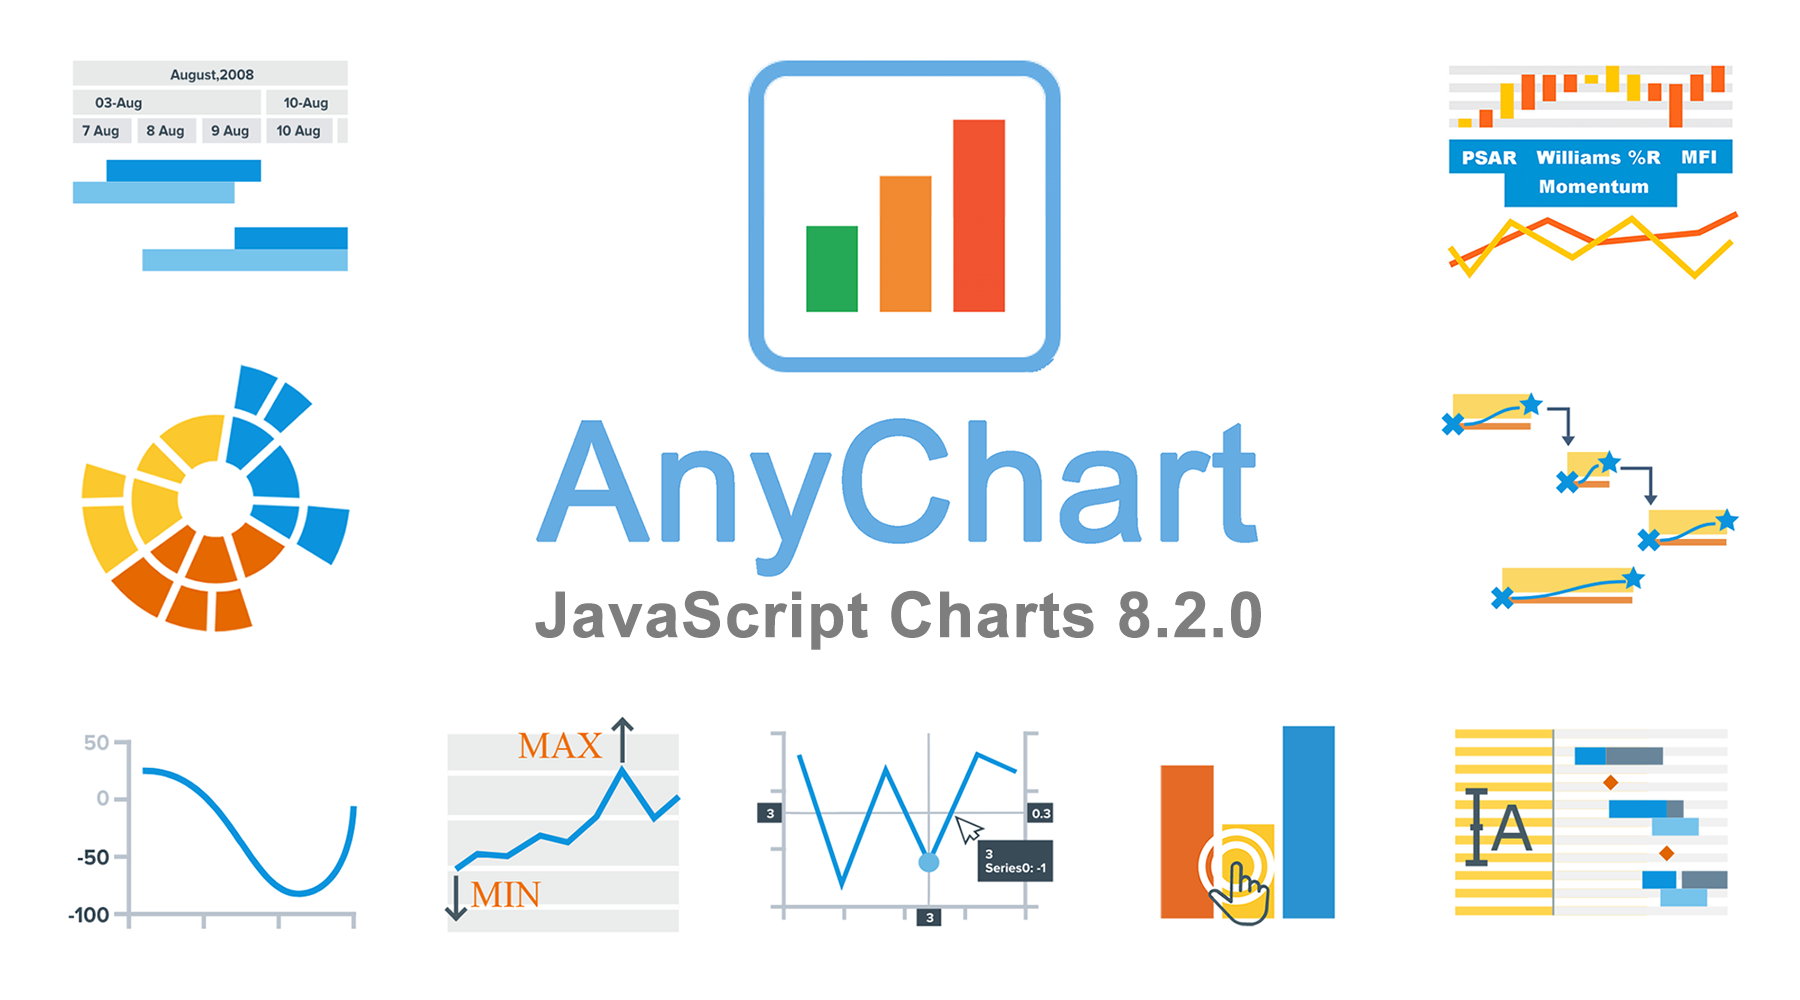 The time has come for another major update of our JavaScript chart libraries, recognized the best in JavaScript technologies earlier this year!
Meet version 8.2.0 of AnyChart, AnyStock, AnyGantt and AnyMap!
To start with, here’s a quick list of what major new cool features have been delivered to our interactive data visualization solutions with this new release:
- Sunburst Chart;
- negative logarithmic scale;
- crosshair multiple labels;
- minimum/maximum labels;
- new technical indicators and additional touch support in stock charts;
- custom drawing, data grid live editor, and new timeline in Gantt charts
Now, let’s take a closer look at each of the major news of AnyChart 8.2.0 and then see what’s next on our roadmap.
- Categories: AnyChart charting component, AnyGantt, AnyMap, AnyStock, Financial charts, Gantt Chart, HTML5, JavaScript, News, Stock charts
- 2 Comments »
Custom Technical Indicators in JavaScript Stock Charts — Challenge AnyChart!
March 14th, 2018 by Irina Maximova
It is a pleasure to present a new Challenge AnyChart article! We love our customers and their original tasks, so we continue to show the unlimited capabilities of our JavaScript charting libraries to the blog readers.
The heroes of today’s tutorial are custom technical indicators. Below we’ll explore how to add them to a JS (HTML5) stock chart step by step. So, let’s begin.
- Categories: AnyChart charting component, AnyStock, Big Data, Business Intelligence, Challenge AnyChart!, Charts and Art, Financial charts, HTML5, JavaScript, Stock charts, Tips and tricks
- 1 Comment »
Best JavaScript Technology: AnyChart JS Charts Library Wins 2018 DEVIES Award!
February 6th, 2018 by AnyChart Team It’s happened! Our AnyChart JS Charts library has just been officially named the best in JavaScript Technology for innovation and received a prestigious DEVIES award in California! (See all the 2018 DEVIES winners — one for each of the 15 categories.)
2018 DEVIES is reported to be the world’s leading DevTech Awards event, taking place these days during DeveloperWeek in Oakland, CA, the largest developer expo and conference series globally.
- Categories: AnyChart charting component, AnyGantt, AnyMap, AnyStock, HTML5, JavaScript, News, Qlik, Success stories
- 6 Comments »
Happy New Year in JavaScript Charting: AnyChart 8.1.0 Is Out!
December 20th, 2017 by AnyChart Team The New Year and Christmas are already just around the corner, and we have something astonishing for you in this magical time! The next major update for our product family of JavaScript charting libraries is now released, so meet AnyChart 8.1.0!
Check out what new cool and useful features are delivered in the new versions of our HTML5-based interactive data visualization solutions AnyChart, AnyStock, AnyGantt and AnyMap, as well as what we are going to work on next.
- Categories: AnyChart charting component, AnyGantt, AnyMap, AnyStock, Financial charts, Gantt Chart, HTML5, JavaScript, News, Qlik, Stock charts
- 2 Comments »
Modular JavaScript Charting: AnyChart 8 Premiere
October 2nd, 2017 by AnyChart Team Fall is an amazing time for TV, movie, theater, and other art lovers as that’s when a lot of premieres are being launched. Well, we are happy to contribute to the debut mainstream this time! Meet AnyChart 8, a modular JavaScript charting system taking the convenience, performance, and customization in the art of interactive data visualization to the next level.
Join us in reviewing the core innovations delivered in the 8th, module-based generation of AnyChart, including the brand new features now available in our JS charting libraries AnyChart, AnyStock, AnyGantt, and AnyMap, as well as what else is in our nearest plans.
AnyChart JS Charts 8.0.0: Modules, Custom Builds, and Much More
The 8.0.0 release of the AnyChart, AnyGantt, AnyMap, and AnyStock JavaScript (HTML5) charting libraries delivers a lot of brand new features and technical improvements. Please see the list below for a quick overview of what’s new.
- Categories: AnyChart charting component, AnyGantt, AnyMap, AnyStock, Dashboards, Financial charts, Gantt Chart, HTML5, JavaScript, News, Stock charts
- 5 Comments »
Data Visualization with JavaScript: The Story of AnyChart JS Charts
September 7th, 2017 by AnyChart Team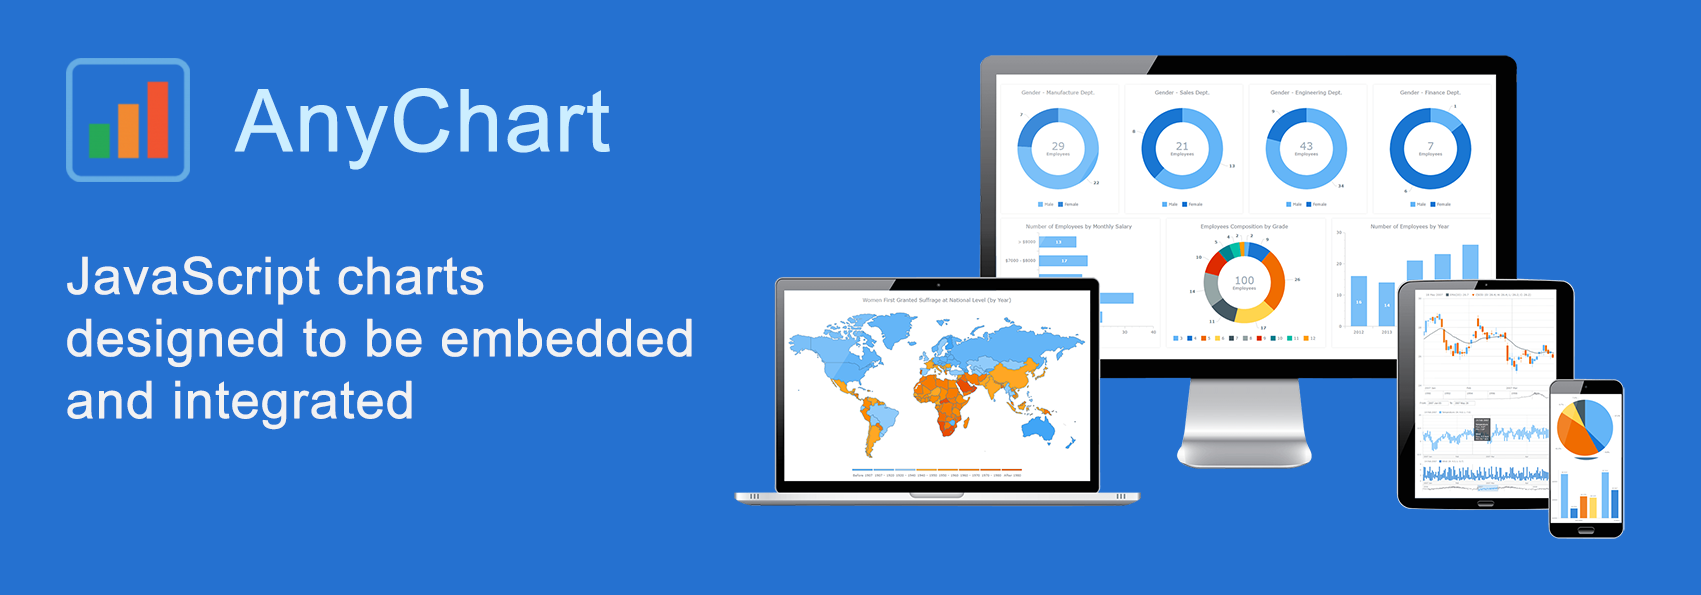 AnyChart is a flexible JavaScript (HTML5) based solution that allows you to create interactive and great looking charts. It is a cross-browser and cross-platform charting solution intended for everybody who deals with creation of dashboard, reporting, analytics, statistical, financial or any other data visualization solutions. AnyChart works everywhere -PCs, Macs, iPhones, iPads, Android devices and helps businesses transform operational data into actionable information.
Kevin William David interviewed Anton Baranchuk, CEO at AnyChart to know more.
- Categories: AnyChart charting component, AnyGantt, AnyMap, AnyStock, Business Intelligence, Flash platform, GraphicsJS, HTML5, JavaScript, Oracle Apex, Qlik, Success stories
- No Comments »
AnyChart JavaScript Charting Libraries 7.14.0 Released: Can’t Stop Perfecting Data Visualization!
May 30th, 2017 by AnyChart Team![]() Here are the spring May flowers we promised. After the hard work put in over the past months, we’re happy to announce that the 7.14.0 release of our JavaScript charting libraries AnyChart, AnyStock, AnyMap, and AnyGantt is out and ready to download! It brings you new cool features and important improvements that will make your data visualization life even better.
Here are the spring May flowers we promised. After the hard work put in over the past months, we’re happy to announce that the 7.14.0 release of our JavaScript charting libraries AnyChart, AnyStock, AnyMap, and AnyGantt is out and ready to download! It brings you new cool features and important improvements that will make your data visualization life even better.
Now, we invite you to discover all the new JavaScript/HTML5 charting capabilities that the 7.14.0 version of AnyChart’s data visualization software product family has to offer to you. Here’s a quick overview…
- Categories: AnyChart charting component, AnyGantt, AnyMap, AnyStock, Business Intelligence, Dashboards, Financial charts, Gantt Chart, HTML5, JavaScript, News, Stock charts
- 7 Comments »
JavaScript Charts Library Update 7.13.1 Released for AnyChart, AnyStock, AnyMap, AnyGantt
April 18th, 2017 by AnyChart Team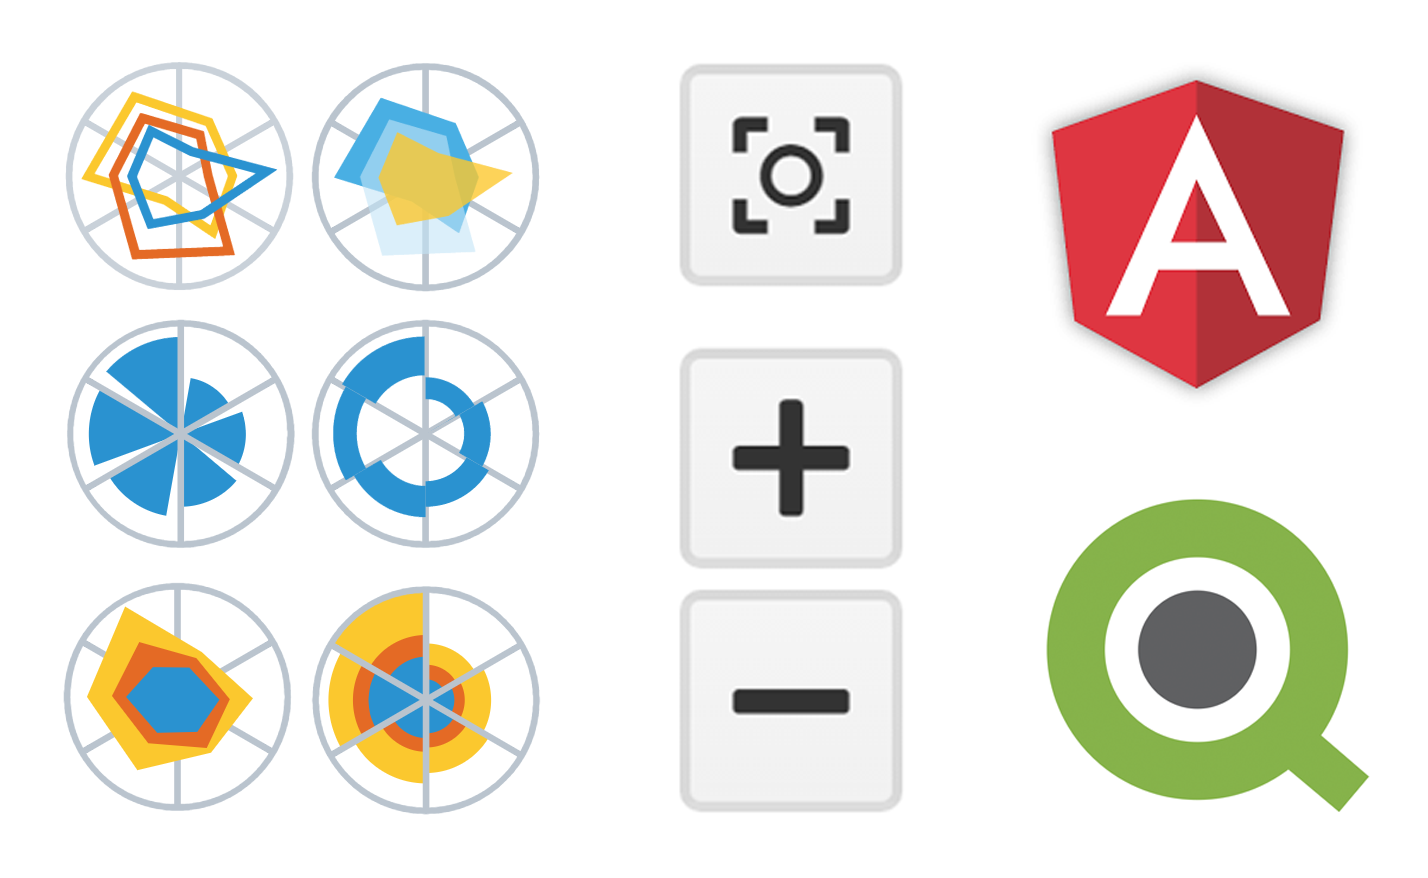 “Sweet April showers do spring May flowers,” once wrote 16th-century English poet Thomas Tusser. Well, our customers already know that AnyChart’s April brings flowers, too! Last year we launched the great 7.10.0 version of the AnyChart JavaScript charts library and, basically, of our whole data visualization product family. Now, in the year of 2017, April brings you another great update.
So, please all greet the 7.13.1 release of AnyChart, AnyMap, AnyStock, and AnyGantt – our cute first spring flowers grown especially for you!
- Categories: AnyChart charting component, AnyGantt, AnyMap, AnyStock, HTML5, JavaScript, News, Qlik
- 2 Comments »
How to Integrate AnyChart JavaScript Charts in SAP Web UI
March 30th, 2017 by Sandor van der Neut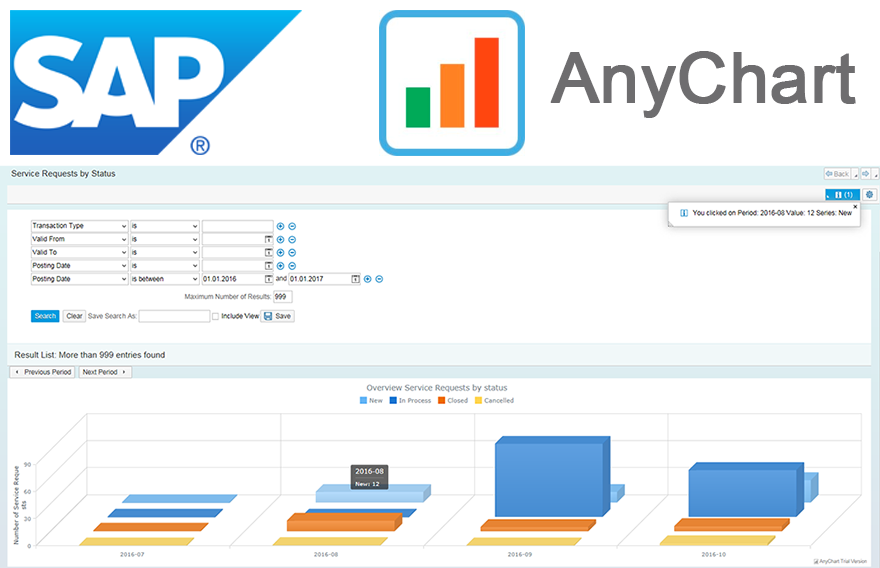 We as ‘mere’ humans are not very good at processing raw statistical data visually when it’s delivered to us in an unrefined form. We are, however, very good in detecting complex patterns when data is presented to us in a graph or a chart. It is therefore no wonder that as a developer you often get the requirement to represent data in a more comprehensible form. When you want to visualize data in the SAP Web UI in a more graphical way the standard possibilities available to you are rather limited. Luckily there are ways to overcome these limitations. When you combine SAP with the graphical power of AnyChart JS Charts a whole range of new possibilities will become available to you.
In this blog I will describe how you can integrate AnyChart in the SAP Web UI with relative ease, how you can feed AnyChart objects with SAP data using both a ‘pull’ and a ‘push’ mechanism and how you can respond in the SAP backend to the events triggered from user interaction with an AnyChart object.
- Categories: AnyChart charting component, AnyGantt, AnyMap, AnyStock, Business Intelligence, Dashboards, HTML5, JavaScript, Tips and tricks
- No Comments »
AnyChart JavaScript Charting Libraries 7.13.0 Released, Source Code Opened
February 28th, 2017 by AnyChart TeamReliability has always been our main priority at AnyChart JS Charts. And you definitely know you can trust us, with our JavaScript charting libraries’ public roadmaps, consistent releases, and highly experienced Quality Assurance team. Today we are glad to tell you about another major step that we have just taken in this regard:
AnyChart is now open!
 |
Basically, it means we fully opened the following: – Source code of our JavaScript charting libraries – it is now available for review and download on GitHub. – Issue tracker – so you can help us further improve our products, if you can/want. – Build scripts – to let you compile custom binaries with the chart types you need. – List of branches – to demonstrate our development cycle and prove you can trust us. |
However, that’s not all! In addition to becoming open, we introduced multiple important improvements and new features with the new major release. Let’s see now what else was added to the 7.13.0 versions of our JavaScript charting libraries – AnyChart (JS charts), AnyStock (timeline data based JS charts), AnyMap (JS maps), and AnyGantt (JS charts for project/resource management).
JavaScript Charting 7.13.0: New Features in AnyChart, AnyStock, AnyMap, AnyGantt
 |
Plugins To make using our JavaScript charting libraries with the most popular JavaScript frameworks as easy as possible, we created special plugins for AngularJS, Ember.js, jQuery, Meteor, Node.js, and React. Save your time and effort by using these plugins when utilizing one of these frameworks. |
 |
Social Network Sharing Now any JS (HTML5) chart powered by our JavaScript charting libraries can be easily shared on social networks Facebook, LinkedIn, Pinterest, and Twitter. We included this function in the context menu, so this can be quickly done from there. Properties specific to a particular social network can be set in the exports namespace. |
 |
Vertical Charts Most of the series in our AnyChart and AnyStock Javascript charting libraries are now also available in the vertical orientation. Whenever that is what you’re looking for, you are welcome to use the isVertical() method. To make the process of building the most popular vertical chart types even more straightforward, we added special constructors, verticalArea() and verticalLine(). Look at vertical charts in our Gallery. |
 |
Pareto Chart The Pareto chart, named after prominent economist and sociologist Vilfredo Pareto, is currently one of the most popular chart types in the field of management. And we simply could not make you get along without it anymore. So, let’s all welcome the Pareto chart type! Starting from the 7.13.0 version, AnyChart offers it out of the box. Now you can easily create a Pareto chart by using the anychart.pareto() constructor. |
 |
Step, Stick, Jump Line Charts Please also meet these major new arrivals to the list of chart types supported in AnyChart and AnyStock. We introduced Backward and Forward modifications of the Step chart as well as the Jump Line and Stick. The Step Line Forward and Step Line Backward charts are now available with the help of the stepDirection() method. To add a Jump Line chart or create a Stick chart, use the jumpLine() and stick() methods. |
 |
Custom Series Drawing Imagination is freedom. You definitely need to easily visualize your data exactly the way you see it. And we keep on doing our best to deliver you the ultimate customization features. Now we added the new rendering() method to AnyChart and AnyStock so you could put any creative idea into action and build any custom chart. Custom drawing examples: Frog Chart, Cherry Chart, and Column Chart with Rounded Edges. |
 |
Legend Customization We added new options to work with the legend in AnyChart, AnyMap and AnyStock. First, the itemsLayout() now lets you improve the legend’s visual appearance, especially when multiple series are displayed. Second, the legend can now be placed inside a data plot (the positionMode() method) to facilitate a more efficient use of space on a chart. Third, the drag() method allows you to easily position the legend on your JS chart. |
") |
New Technical Indicators To expand the range of stock JS (HTML5) charting opportunities available in AnyStock, we added more of technical indicators: Adaptive Moving Average (AMA); Modified Moving Average (MMA); Average True Range (ATR); KDJ; Bollinger Bands (BBands); Bollinger Bands %B (BBands %B); Bollinger Bands Width (BBands Width); Stochastic Oscillator (Fast / Slow / Full). Learn more of all the technical indicators in our Docs. |
 |
Individual Point Settings Sometimes applying individual settings to a particular data point can be very useful. Although that might not be habitual for stock JS (HTML5) charts, we decided to provide you with this great customization opportunity in the AnyStock JavaScript charting library. Starting from the 7.13.0 release, you are allowed use the allowPointsSettings parameter in the anychart.stock() constructor to enable this option. |
 |
Resource Chart Interactivity With the previous, 7.12.0 release of AnyGantt, we introduced the redesigned Resource chart. In the new, 7.13.0 version of this HTML5 / JS library, we are glad to present you several major new features added this time. First of all, now you can enable and adjust the Hover and Select interactivity settings in our new Resource charts. |
 |
Resource Chart Events With the previous, 7.12.0 release of AnyGantt, we introduced the redesigned Resource chart. In the new, 7.13.0 version of this JavaScript charting library, we are glad to present you several major new features added this time. First of all, now you can enable and adjust the Hover and Select interactivity settings in our new Resource charts. |
 |
Resource Chart Tooltips Third, we have also added Tooltips to the new Resource chart with the current 7.13.0 release of AnyGantt. They will help you display additional information about each activity you are visualizing, in a convenient, greatly interactive way. |
 |
Connector Customization in Gantt Charts Of course, we could not leave our Gantt charts without proper attention with regard to new features. This time we made tuning the visual appearance of the Live Editing mode in HTML5 Gantt charts more flexible by adding the new Connector Customization features. You are welcome to take a look at them in action in AnyGantt’s Gallery. |
We hope you like the 7.13.0 versions of our JavaScript charting libraries and enjoy the openness of AnyChart!
By the way, we have already scheduled the next major update on May 2017. Please see the roadmaps of AnyChart, AnyStock, AnyMap and AnyGantt in case you would like to find out what you will get with that release. All in all, 2017 is going to be no less fruitful in terms of new features in AnyChart JS Charts than the rich year of 2016!
Please contact our Support Team at any time when you have any questions or requests for new features. We’ll be glad to be of help, as always!
AnyChart’s version history: https://www.anychart.com/products/anychart/history/.
AnyStock’s version history: https://www.anychart.com/products/anystock/history/.
AnyMap’s version history: https://www.anychart.com/products/anymap/history/.
AnyGantt’s version history: https://www.anychart.com/products/anygantt/history/.
Download our JavaScript charting libraries: https://www.anychart.com/download/.
Purchase a license (renovated Buy page): https://www.anychart.com/buy/.
- Categories: AnyChart charting component, AnyGantt, AnyMap, AnyStock, Financial charts, Gantt Chart, HTML5, JavaScript, News, Stock charts
- 6 Comments »