 We as ‘mere’ humans are not very good at processing raw statistical data visually when it’s delivered to us in an unrefined form. We are, however, very good in detecting complex patterns when data is presented to us in a graph or a chart. It is therefore no wonder that as a developer you often get the requirement to represent data in a more comprehensible form. When you want to visualize data in the SAP Web UI in a more graphical way the standard possibilities available to you are rather limited. Luckily there are ways to overcome these limitations. When you combine SAP with the graphical power of AnyChart JS Charts a whole range of new possibilities will become available to you.
In this blog I will describe how you can integrate AnyChart in the SAP Web UI with relative ease, how you can feed AnyChart objects with SAP data using both a ‘pull’ and a ‘push’ mechanism and how you can respond in the SAP backend to the events triggered from user interaction with an AnyChart object.
Display an AnyChart object in the SAP Web UI
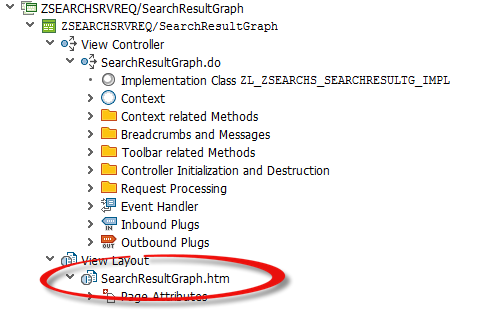
I found that integrating an AnyChart object in the SAP Web UI is actually quite simple as a view in the SAP Web UI contains an HTML page with the possibility to add your own (JavaScript) code. The HTML part of your Web UI view can be accessed through the UI component workbench as shown below.
To be able to show an AnyChart object in the SAP Web UI the following steps need to be executed.
First you have to make the AnyChart JavaScript libraries available to your HTML page. To get access to your JavaScript libraries you have to add the following or a similar line of script to your HTML page.
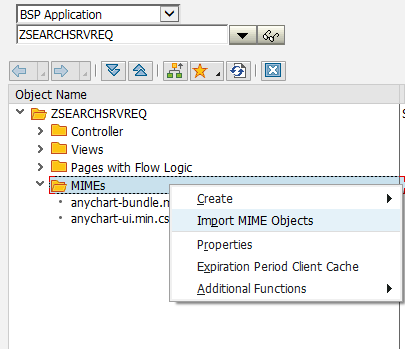
<script src="https://cdn.anychart.com/js/7.12.0/anychart-bundle.min.js"></script>There is also an alternative; it is from a performance point of view probably better to store the JavaScript sources locally as MIME objects in your BSP application. If you are using the same library in multiple applications you can choose to store them in the MIME objects of the BSP application CRM_UI_FRAME.
Uploading a file as a MIME object can be done in the Object Navigator transaction (SE80) in SAP. Just select the appropriate BSP application and upload your files as can be seen in the example below.
You then can get access to your source files by adding the following code:
<script src="/sap/bc/bsp/sap/your BSP application/anychart-bundle.min.js"></script>The same approach can also be used to store any CSS files if necessary.
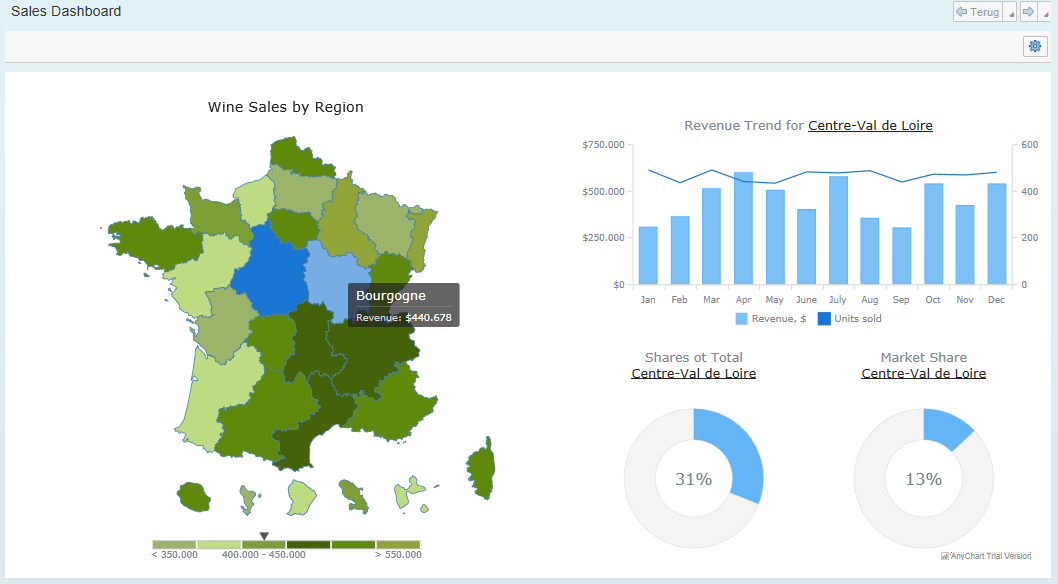
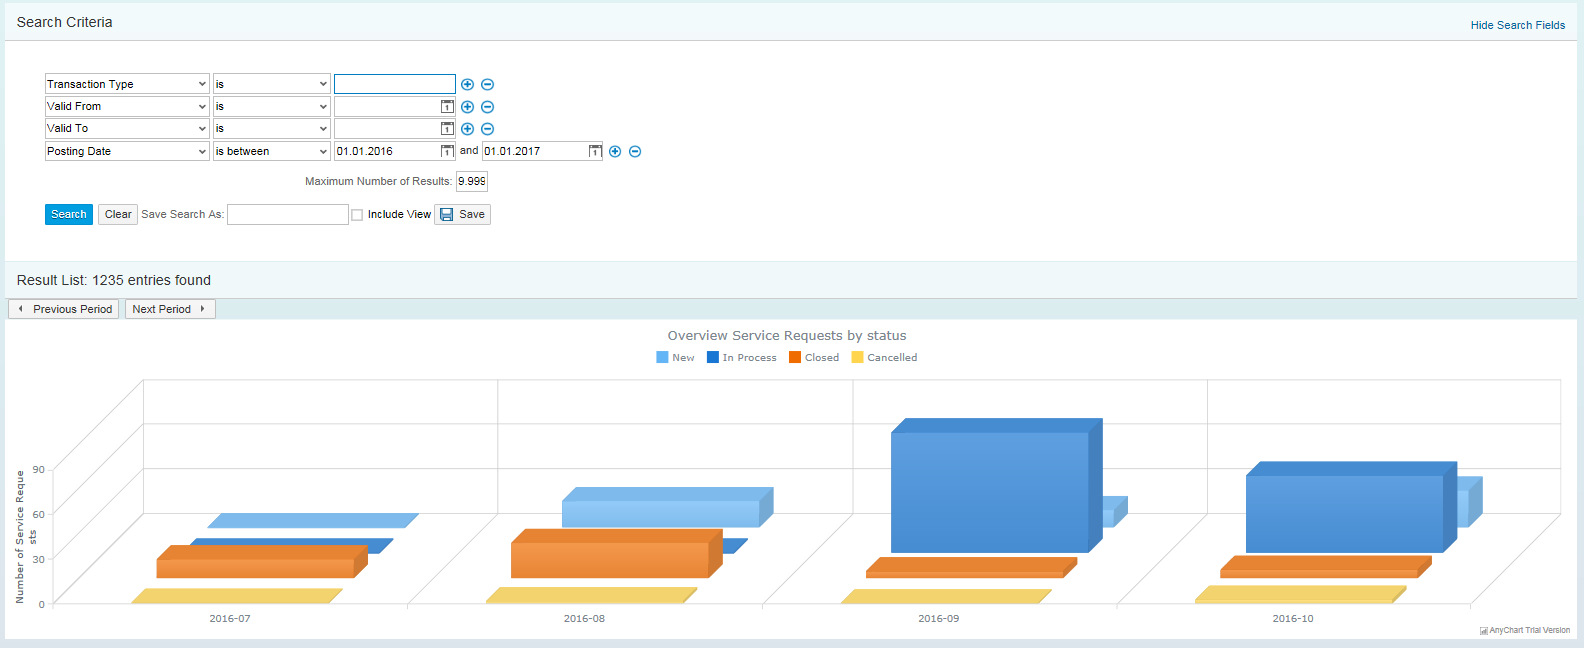
With the sources available you now can add the code to generate your charts and basically you now can use any graph, chart or object AnyChart can offer. In the example below (copied from one of the dashboards available in the AnyChart page demo section) you can see what the end result might look like.
One word of advice when copying JavaScript code in the HTML page of a Web UI view: The standard SAP editor is not recognizing // as a line comment indicator. So avoid this type of commenting because SAP won’t see it as a commented out line but as a line of code and it will mess up things in a big way.
How to pass data from SAP to AnyChart
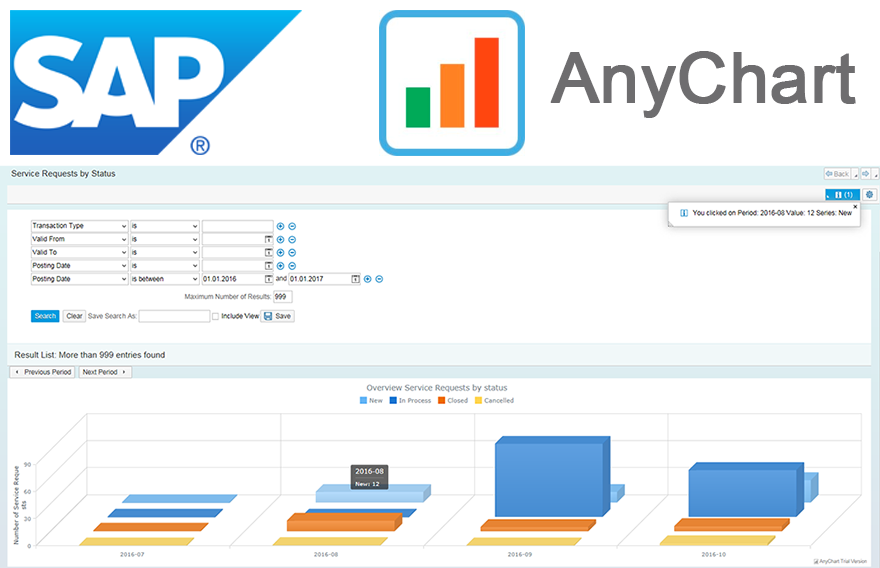
Now that we have seen that we can use the graphical power of an AnyChart object in the view of a Web UI component, we have to find a way to provide our charts and graphs with actual data coming from the SAP backend. To test this I decided to build a new Web UI application that will show a graph with all service requests for a certain period of time grouped by their functional status. I used the Multi-Series 3D Column Chart from the Chart Gallery as a base but I will come back to that later.
The first thing to do is to get the data from the SAP backend in your HTML page. This is actually not such a big deal because in your HTML code you have access to your view controller class and all its methods. So I started by creating a new method in the view controller class, GET_JSON_STRING. The method will return the data you want to display as a string in JSON format. I decided to pass the data in JSON format as it can be easily generated in ABAP from an internal table and can be translated to a JavaScript data object without much effort which is very convenient.
The method might look something like this:
METHOD get_json_string.

  "Declare Data Format
  TYPES:
    BEGIN OF ty_json_data,
      field1    TYPE string,
      field2    TYPE string,
      field3    TYPE string,
      field4    TYPE string,
      field5    TYPE string,
    END OF ty_json_data.

  "Define an internal table
  DATA:
    lt_json_data  TYPE STANDARD TABLE OF ty_json_data WITH DEFAULT KEY.

  "Write some code to populate your table

  "Convert SAP internal table to JSON string
  DATA(json_writer) = cl_sxml_string_writer=>create( type = if_sxml=>co_xt_json ).

  CALL TRANSFORMATION id SOURCE text = lt_json_data RESULT XML json_writer.

  DATA(result_string) = json_writer->get_output( ).

  DATA(lo_conversion) = cl_abap_conv_in_ce=>create( EXPORTING input =  json_writer->get_output( ) ).

  lo_conversion->read( IMPORTING data = re_result ).

ENDMETHOD.
With the ABAP part in place we have to make the data available in JavaScript as well. This can be done by calling the method GET_JSON_STRING from the controller class and subsequently create a JavaScript data object using the JSON.parse command as shown below.
var data = JSON.parse('<%= controller->get_json_string( ). %>').text;Now that we have the data available there is only one step left to do, we have to convert the data to a format that AnyChart can handle. To be able to achieve that let’s first take a closer look at what kind of data format AnyChart is accepting. In the JavaScript API documentation AnyChart advices you to work with data sets (class anychart.data.Set) which can be instantiated using the following code:
var dataSet = anychart.data.set(data); // creates dataWhere the variable data can be an array with numbers, strings and functions, an array of arrays, an array of objects or a multi-typed array. (For more information see the AnyChart API Reference.)
In fact the exact data format that AnyChart needs is related to the type of graph you want to show. In this particular example AnyChart was expecting an array of arrays which was achieved by the following JavaScript code. But there are probably other ways to do it.
var dataSet = anychart.data.set();

for (i = 0; i < data.length; i++){
  dataSet.append( [ data[i].period,
                    data[i].new,
                    data[i].inprocess,
                    data[i].closed,
                    data[i].cancelled ] );
};
With this last piece of code in place we managed to pass the data from our SAP backend to the AnyChart graph and we ended up with a fully functional Web UI application. The final result was rather satisfying if I may say so myself!
Working with more complex data structures
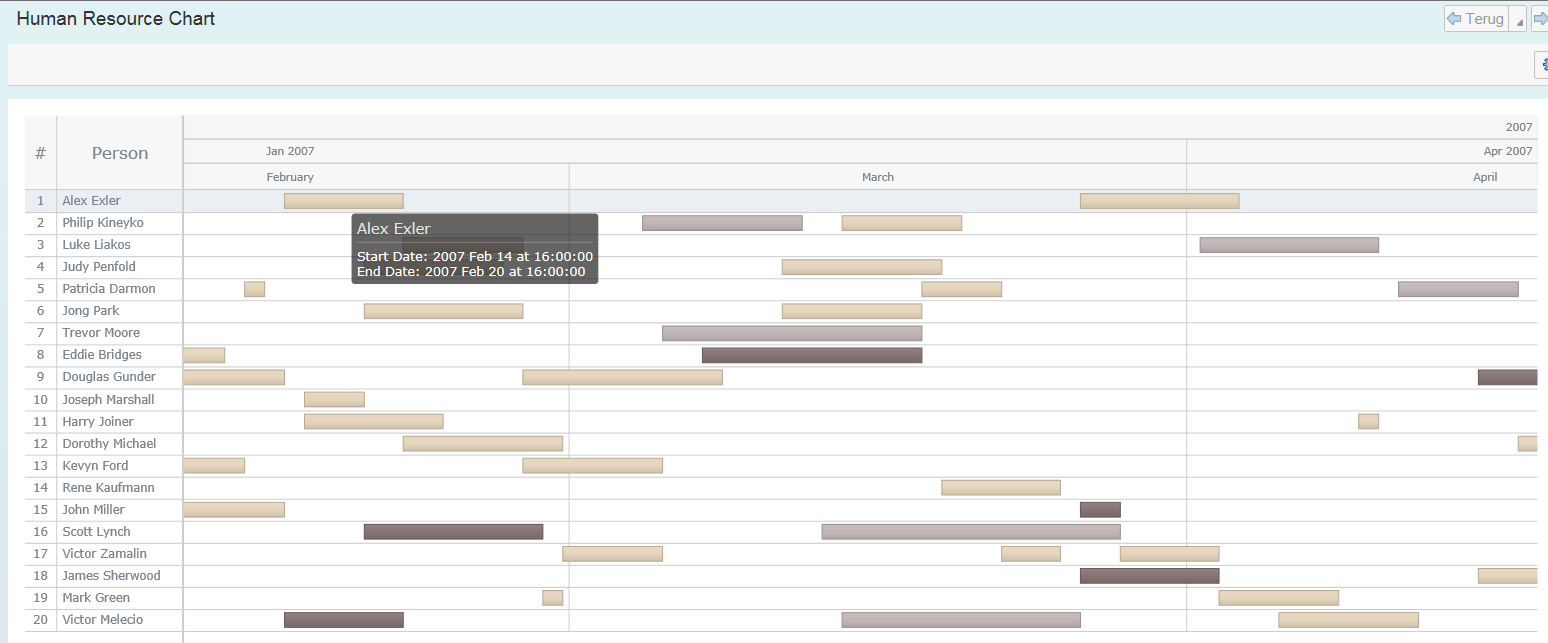
In this previous example the data format was rather simple so I decided to up the ante and create an example featuring AnyChart’s Human Resource Chart which is using a far more complex data structure as input. The basic principles are however the same. We first build an internal table in ABAP and convert it to a JSON string.
lt_hr_chart_data = VALUE #( base lt_hr_chart_data ( id      = '1'
                                                    name    = 'Alex Exler'
                                                    periods = VALUE tt_periods( ( id     = '1_1'
                                                                                  start  = '1171468800000'
                                                                                  end    = '1171987200000'
                                                                                  stroke = '#B8AA96'
                                                                                  fill-angle = '90'
                                                                                  fill-keys  =  VALUE tt_keys( ( color = '#CFC0A9' position = '0' )
                                                                                                               ( color = '#E6D5BC' position = '0.38' )
                                                                                                               ( color = '#E8D9C3' position = '1' ) ) )
                                                                                ( id     = '1_2'
                                                                                  start  = '1174921200000'
                                                                                  end    = '1175612400000'
                                                                                  stroke = '#B8AA96'
                                                                                  fill-angle = '90'
                                                                                  fill-keys  =  VALUE tt_keys( ( color = '#CFC0A9' position = '0' )
                                                                                                               ( color = '#E6D5BC' position = '0.38' )
                                                                                                               ( color = '#E8D9C3' position = '1' ) ) )
                                                                                ( id     = '1_3'
                                                                                  start  = '1177599600000'
                                                                                  end    = '1178550000000'
                                                                                  stroke = '#B8AA96'
                                                                                  fill-angle = '90'
                                                                                  fill-keys  =  VALUE tt_keys( ( color = '#CFC0A9' position = '0' )
                                                                                                               ( color = '#E6D5BC' position = '0.38' )
                                                                                                               ( color = '#E8D9C3' position = '1' ) ) ) ) ) ).
Then in JavaScript we call the method from the view controller that provides us with the data and use JSON.parse to get a JavaScript data object.
var data = JSON.parse('<%= controller->get_data( ). %>').json;Finally we convert the data to a format AnyChart can handle, but actually there is no finally because the Human Resource Chart can handle this data format right of the bat as it is expecting an array of objects. So if we build our data correctly in the SAP backend we don’t have to do any additional conversion in the JavaScript code. Pretty cool in my opinion and one of the main reasons I use the JSON data format. In the example below you can see the final result.
Use Web sockets to push data to AnyChart (ABAP Push Channel)
In the last two examples we called a method from the view controller class to ‘pull’ the data from the SAP backend into our AnyChart graph. Besides that method SAP also offers the possibility to ‘push’ data from the SAP backend to any web page using a web socket connection (it is called APC which stands for ABAP Push Channel and if you want to read more about it this blog is a good place to start). Using the ‘push’ messages can be useful if you have, for example, a graph or a chart you want to update every time something changes without using a periodic polling mechanism of some sorts. So the SAP backend will tell you when it’s time to update your view.
Now let’s try to integrate it with an AnyChart graph.
The first thing we need is to set up a working APC channel in SAP. It will however go too far to describe this in detail in this blog. So for now we only need to know that we have a working APC channel available in the SAP system. The second thing to do is write some JavaScript inside our page to open the web socket connection and write some logic to update the graph once we receive a push message. In the example I open the web socket connection based on the URL of my ABAP Push Channel and when I receive a message I parse the JSON data and add a new data set to my graph while removing the oldest one.
//Open Websocket connection
if ('WebSocket' in window){
  var connection = new WebSocket('<%= controller->gv_apc_url %>');
}

//Once we receive a new message we add a new dataSet and remove the oldest one
connection.onmessage = function(e){

   var data = JSON.parse(e.data).json;

   dataSet.append([ data.month,
                    data.value1,
                    data.value2,
                    data.value3,
                     ]);

   dataSet.remove(0);
};
All we have to do now is taking care of the ABAP part. To make this all fly I wrote a small program that pushes 12 times a new data set (in JSON format again) to the graph with an interval of a second. This will update our graph accordingly by adding new dataset entries and removing the old ones.
DO 12 TIMES.
  WAIT UP TO 1 SECONDS.

  ls_message = lt_message[ sy-index ].

  TRY.
      DATA(lo_json_writer) = cl_sxml_string_writer=>create( type = if_sxml=>co_xt_json ).
      CALL TRANSFORMATION id SOURCE json = ls_message RESULT XML lo_json_writer.
      DATA(lv_json_xstring) = lo_json_writer->get_output( ).
      DATA(lo_conversion)   = cl_abap_conv_in_ce=>create( EXPORTING input =  lo_json_writer->get_output( ) ).

      lo_conversion->read( IMPORTING data = lv_json_string ).
      lv_json_string = |{ lv_json_string CASE = LOWER }|.
  ENDTRY.

  TRY.
      "Send the message over the APC using AMC
      CAST if_amc_message_producer_text( cl_amc_channel_manager=>create_message_producer( i_application_id       = |{ '' }|
                                                                                          i_channel_id           = |{ '' }|
                                                                                          i_channel_extension_id = space ) )->send( i_message = |{ lv_json_string }| ).

    CATCH cx_amc_error INTO DATA(lo_exception_amc).
      WRITE: / |{ lo_exception_amc->get_text( ) }|.

  ENDTRY.

ENDDO.
The final result can be seen in the GIF below. Check the new month’s appearing on the right and old ones disappear on the left. I think it’s pretty cool!
Handle events in SAP backend
We have seen so far that we are able to display AnyChart graphs and charts in the SAP Web UI and that we can feed it with data using a ‘pull’ and a ‘push’ mechanism, but for a full integration it would be nice if our SAP backend is able to react on events triggered from the AnyChart objects. So I went back to my service request application and I wanted SAP to be able to register which bar in the 3D graph has been clicked.
To be able to do this you first have to add an event listener method to you chart with the specific event you want to act on. Adding an event listener in AnyChart is simple and in the example below we have added a listener for the point click event in to our chart.
chart.listen("pointClick", function(event){
  //Place your logic here
});
The second thing we need is an HTML event that will fire a server event that can be picked up by the SAP backend. This can be done by adding an HTMLB event to your HTML page which looks like this.
<bsp:htmlbEvent name    = "firePointClicked"
                id      = "pointClicked"
                onClick = "pointClicked"
                p1      = "p1"
                p2      = "p2"
                p3      = "p3" />
With this in place we can now call our HTMLB event from our listen method and pass any relevant data along as parameters.
chart.listen("pointClick", function(event){
return firePointClicked( String( event.iterator.get( 'x' ) ),
String( event.iterator.get( 'value' ) ),
String( event.point.getSeries().name() ) );
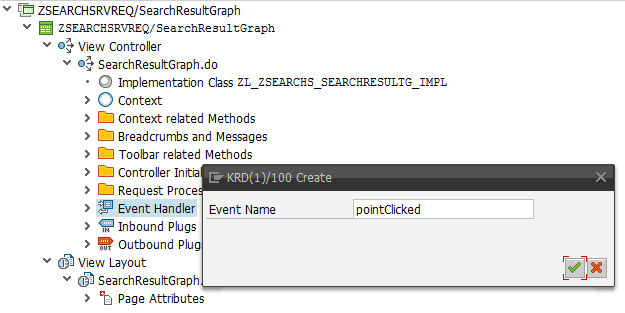
});Last but not least we have to create an event handler method in our SAP view controller class that will contain our business logic. In the component workbench we generate an event handler method with the same name as the onClick parameter we defined in our HTMLB event (case sensitive!) as shown below.
In the generated method we can add our business logic. In this case I will just create an information message to show which bar in the graph has been selected based on the parameters that have been passed.
METHOD eh_onpointclicked.

  "Get a reference to the global message service
  DATA(lo_msg_service) = me->view_manager->get_message_service( ).

  "Give a message with the event parameters
  IF htmlb_event_ex IS BOUND.
    lo_msg_service->add_message( EXPORTING iv_msg_type    = 'I'
                                           iv_msg_id      = '00'
                                           iv_msg_number  = 001
                                           iv_msg_v1      = | You clicked on |
                                           iv_msg_v2      = | Period: | && CAST cl_bsp_htmlb_event( htmlb_event_ex )->p1
                                           iv_msg_v3      = | Value: |  && CAST cl_bsp_htmlb_event( htmlb_event_ex )->p2
                                           iv_msg_v4      = | Series: | && CAST cl_bsp_htmlb_event( htmlb_event_ex )->p3 ).
  ENDIF.

ENDMETHOD
With everything in place we now see a message generated from our backend telling us exactly which bar is clicked as you can see below.
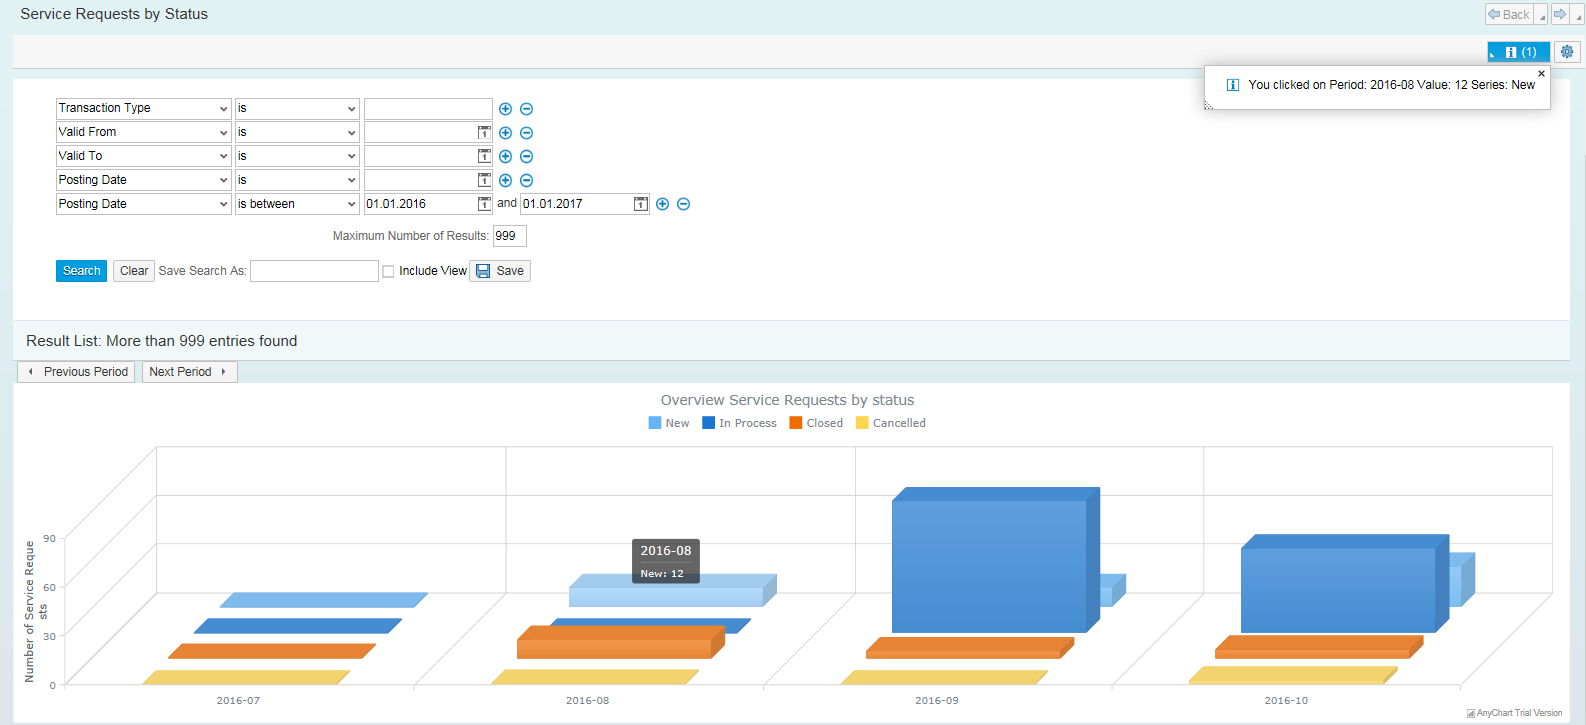
This proves that we are able to react in the SAP backend on events triggered in an AnyChart object!
Conclusion
With the examples shown in this blog I think I have demonstrated that AnyChart can be integrated in the SAP Web UI without too much effort. You can feed the graphs with data using both a ‘pull’ and a ‘push’ mechanism and you are able to respond to the events triggered from user interaction with an AnyChart object.
I think that combining the graphical power of AnyChart with the SAP Web UI can be a valuable addition because it gives you and your customers more flexibility in how to represent data in a SAP Web UI environment.
I hope you enjoyed this blog; I certainly had fun making it. If you have any additional questions don’t hesitate to contact me.
About Sandor van der Neut
Sandor van der Neut is a SAP developer with more than 15 years experience. He lives in the Netherlands and works for Acorel, an innovative company that is specialized in customer engagement and commerce in the SAP Domain. Acorel’s areas of expertise are SAP CRM, SAP Mobility, SAP Cloud solutions, Hybris Marketing and Hybris Commerce. You can follow the company on Twitter, LinkedIn, Facebook and YouTube.
To keep updated on news and articles that we publish about AnyChart and JavaScript charting and data visualization in general, you are welcome to check our blog and follow AnyChart on Facebook, Twitter and LinkedIn. You can download JavaScript charting libraries AnyChart, AnyMap, AnyStock and AnyGantt here. Licensing options are shown here.
- Categories: AnyChart Charting Component, AnyGantt, AnyMap, AnyStock, Business Intelligence, Dashboards, HTML5, JavaScript, Tips and Tricks
- No Comments »