 AnyChart is a flexible JavaScript (HTML5) based solution that allows you to create interactive and great looking charts. It is a cross-browser and cross-platform charting solution intended for everybody who deals with creation of dashboard, reporting, analytics, statistical, financial or any other data visualization solutions. AnyChart works everywhere -PCs, Macs, iPhones, iPads, Android devices and helps businesses transform operational data into actionable information.
Kevin William David interviewed Anton Baranchuk, CEO at AnyChart to know more.
Hi Anton, So tell us about what you are working on?
We are building a universal engine for interactive data visualization to allow the easy creation of any charts, maps and dashboards from any data and ensure they look and feel great in any web projects, on any platform and in any browser.
As a matter of fact, that’s what the core AnyChart solution already is, a powerful feature-rich JavaScript charting library that seamlessly works with all major technology stacks and databases. You can use it to build any custom dataviz based on HTML5, natively embedding it into websites, corporate apps, mobile projects, SaaS or OEM products of literally any kind.
Currently we market AnyChart JS Charts as a product family consisting of smaller, purpose-specific JavaScript charting libraries: AnyChart for basic charts, AnyStock for date/time based visualizations including but not limited to stock and financial graphics, AnyMap for geo maps and seat maps, and AnyGantt for project Gantt, resource, and PERT charts. But essentially it’s one universal data visualization tool based on our own award-winning open-source GraphicsJS library.

Tell me more about the problem you are trying to solve?
If we think of data visualization from the point of view of graphics and data, that seems to be a pretty straightforward affair. There are many components for developers specific to one programming environment or another, so that has never been a big problem to create a bar chart or a pie chart in VB, Visual C, and so on. However, when it comes to enterprise information systems, corporate reporting, analytics and business intelligence, it’s all more complicated. Generally, a developer does not know in advance what exact situations will occur in terms of data: right or wrong data, small or big data, and so on. At the same time, it’s critical to provide the viewer with a clear, explicit picture on which data truly speaks. That’s the thrilling challenge we accepted from the beginning.
I mean, okay, anyone can find a way to build a certain chart based on certain data in a certain visual or programming environment. What we at AnyChart have been building is an advanced, comprehensive data visualization solution that creates any chart based on any data in any environment. That’s exactly what enterprises need to bring their multi various data to life, and we are here to take the entire burden of data visualization off their shoulders. Indeed, AnyChart is designed for creating any chart out of any data.

How did you start? What’s your brief history?
We started in 2003, at the times of Adobe Flash and the beginning or XML. We realized that it’s possible to extract data in the XML format from any source and then display it as a Flash based chart, and then implemented this idea in AnyChart. Flash was everywhere, so AnyChart succeeded as a one-fits-all data visualization tool.
After the fall of Flash as a universally used environment, we added the SVG support, released the first versions of our JavaScript charting libraries, and completely shifted to HTML5 data visualization. We still support Flash in our charting components, but this part of our job is already tiny and continues decreasing as more and more of our customers adhere to HTML5, the backbone technology of the modern web.
Who are your top competitors & how is AnyChart different from what’s already exists in the market?
Our main competitor is Highcharts, amCharts and FusionCharts still bite off a piece of our target audience of web developers and data professionals, just yet.
The key advantages of AnyChart are clear enough and can be seen with the naked eye. Our JavaScript libraries for data visualization are platform, browser, database and technology framework independent. They support a whole lot of important and unique features out of the box: data mapping and all in all multiple options to work with data (in JavaScript API, XML, JSON, CSV, Google Spreadsheets, and HTML tables), numerous chart types, well-weighed visual design, interactivity and custom drawing features, powerful export and sharing engine, smart localization through ~200 culture-specific locale settings files, and so on.

Basically, everything in AnyChart is highly customizable, and we have an advanced built-in graphics engine — open-source JavaScript drawing library GraphicsJS — that allows web developers to modify charts without limitation. Moreover, AnyChart’s full source code is now opened on GitHub.
With many features and options, is it easy to use your solution?
AnyChart is simple to configure, integrate and customize. We have uniquely comprehensive and detailed chart documentation and API reference, countless JS chart demos including ready-to-use dashboard samples, plugins, and technical integration templates for all major stacks.
Also, we are proud of our dedicated Support Team guaranteeing a fast and attentive response twenty-four seven.
In addition, it is very important that charts powered by AnyChart are accessible to everyone as we adhere to the accessibility best practices, Section 508, W3C’s Web Accessibility Initiative.
Who uses AnyChart? What types of roles do your customers have at their companies?
We are proud of having already earned more than 70% of the Fortune 1000 members and over half of the top 1000 software vendors worldwide. Overall, thousands of companies and organizations use AnyChart, including enterprise giants like Samsung, Microsoft, Oracle, Volkswagen, Bosch, Rolex, McDonald’s, General Electric, Reuters, Lockheed Martin, and many more.

Our customers are from various industries: healthcare, media, software, telecommunications, banking, retail, oil, and so on. Well, data visualization is essential in every company that conducts data analysis and makes, say, BI reports, and now businesses in all major segments are becoming more and more data-driven.
Speaking about specific people, most frequently customers of AnyChart are CTOs, CIOs, project managers, lead developers — basically, everyone responsible for the product development and software engineering.
How are your customers using AnyChart? Could you share a few different use cases?
For the years in the data visualization market, we gained a lot of diverse use cases indeed.
For a start, Oracle integrated AnyChart into APEX, a very popular tool for the web based app development used by more than 200,000 developers from all over the world, to allow charting.
DeviceLock, a leading endpoint DLP solution developer, uses AnyChart to visualize the statistics of their software activity so that information security officers could quickly evaluate the current state of system protection and evaluate potential threats.
Rockford Fosgate, a world leader in car audio, implemented AnyChart in the industry’s first online woofer modeling application, Box Advisor, to show dynamic charts and gauges updated in real time.
One of Europe’s leading weather services Meteomedia displays complex weather maps and forecasts with the help of AnyChart.
These are the use cases that first came to my mind. Visualizing healthcare data, product sales, stock market price movements, all kinds of reports in reporting apps — the scope of use for charts and dashboards powered by AnyChart is very, very wide.
Have there been unique use cases for AnyChart that you hadn’t thought of or expected?
Well, yes, sometimes people and companies use our data visualization solutions in a quite unexpected way. Probably the most striking example here is that AnyChart was used for visualizing the nuclear reaction processes. That’s an amazing example of brilliant graphics, and in this regard that’s a great pity that we cannot really share this publicly, you know. So AnyChart, a business tool, was applied to and appeared to be suitable for visualizing physical processes — that’s a wow!
Were there any early ‘growth hacks’ or tactics that have contributed to your current success?
Partnership with large companies has always been one of the most influential drivers for AnyChart. What I can especially point out here is our deal with Oracle, one of the first massive adopters of our charting solutions.
Once we integrated AnyChart into APEX, we began to receive lots of helpful feedback, numerous use cases, and many other benefits that inspired our huge, quantum leap in terms of support, product development, as well as business overall.
What were some of the biggest challenges while building the product early on and how did you solve them?
In 2003, Flash and XML were still new technologies. As a result, we were receiving a lot of bug reports, faced security and related issues in Flash itself, etc. — well, not everything depended on us.
At the later stages when large enterprises like Oracle became our customers, we started dealing with a massive flow of questions and reports from several thousand developers who would not care that you physically could not reply to all of them at once with detailed explanations. To solve the problem, we completely re-arranged and strengthened the support activity.
One more difficult challenge was the transition from Adobe Flash to HTML5. You remember that Apple did not allow Flash on their iPhones. Then it remained unclear for a long time what technology would be its successor in terms of universality. Finally, HTML5 won and we were forced to build a brand new solution almost from scratch and also fully support both Flash and HTML5 versions during the transition period. Those were the hard times but we successfully dealt with all that in the end.
What have been some of the most interesting integrations you’ve added? Are there any that have been particularly impactful for you?
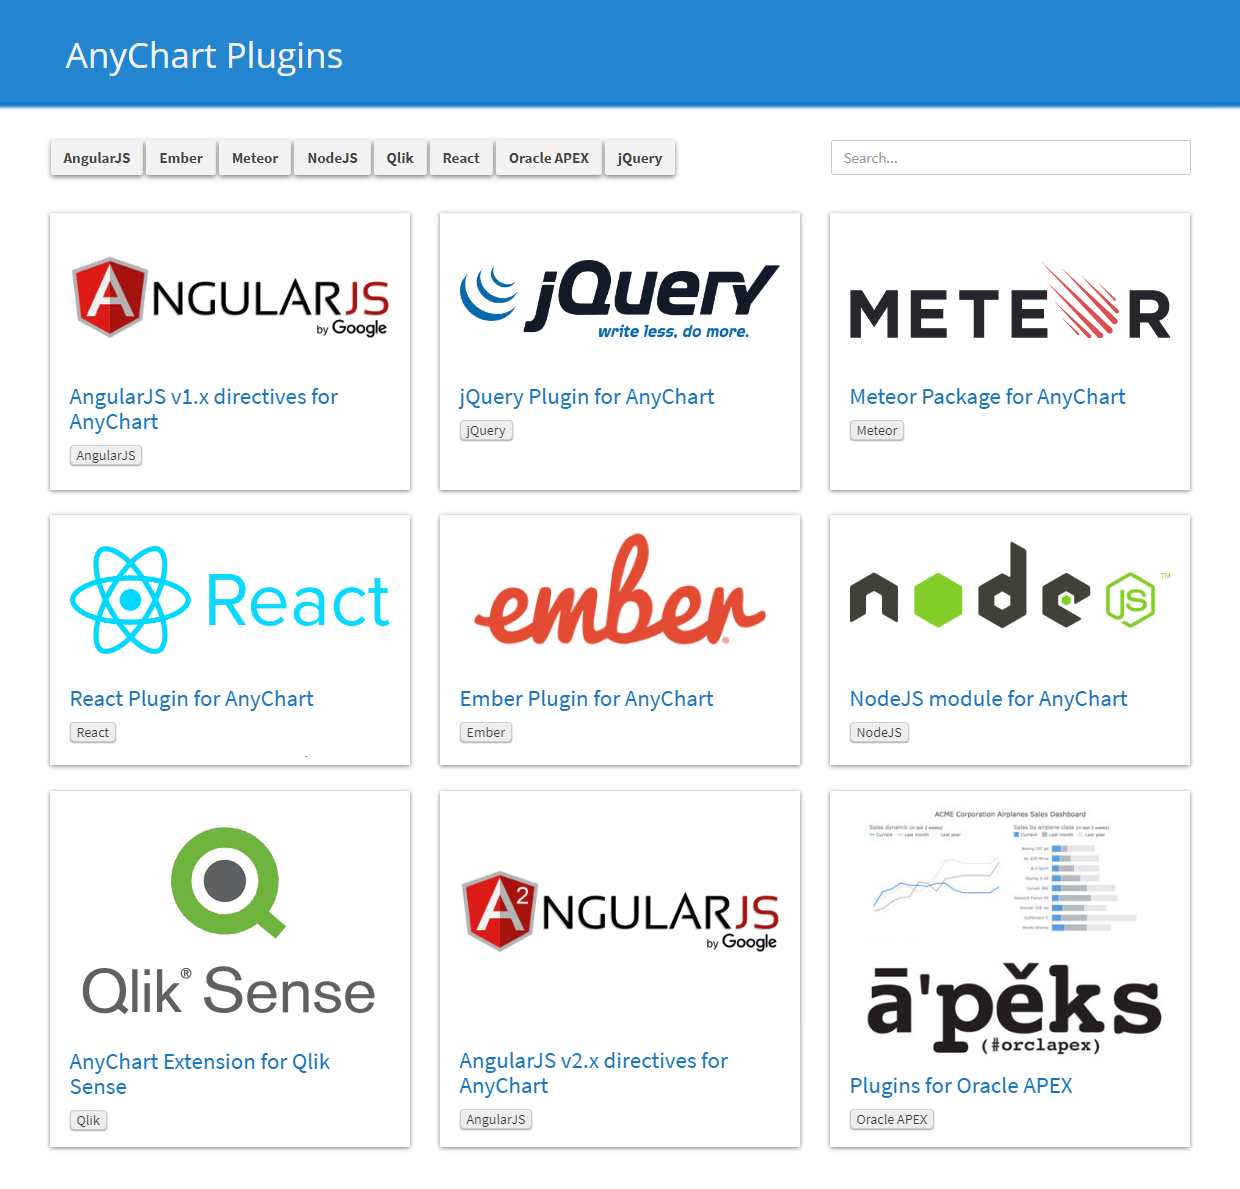
Here I would mention AnyChart plugins for Oracle APEX, Qlik Sense, Angular, Ember.js, jQuery, Meteor, Node.js and React. Basically, all these have been very impactful and made many users of the corresponding solutions our customers as well.
Integration with Qlik Sense is one of the most recent stories. Perhaps it’s especially interesting because this product already had charts, but nevertheless, AnyChart has already become very popular among Qlik Sense users for a much wider range of interactive data visualization features.
Before we end, What are top products that you depend on to run the company & how do you use them?
We have been using Atlassian’s JIRA for a long while, and that’s definitely a must-have in tracking tasks and projects.
In addition, I’d like to highlight Desk.com as an excellent environment for support activities and XMind as a handy tool for making mind maps.
We are also active users of Salesforce, GitHub, and Google’s products like GMail, Docs, and Hangouts — well, I am sure everyone reading this knows them pretty well.
Originally published on Siftery’s Creator Stories: “Add cross-browser and cross-platform interactive charts, dashboards, graphs and maps to your applications“.
- Categories: AnyChart Charting Component, AnyGantt, AnyMap, AnyStock, Business Intelligence, Flash Platform, GraphicsJS, HTML5, JavaScript, Oracle Apex, Qlik, Success Stories
- No Comments »