Qlik Sense Gantt Chart Extension AnyGantt Gets New Awesome Features in Version 4.0
November 1st, 2019 by AnyChart Team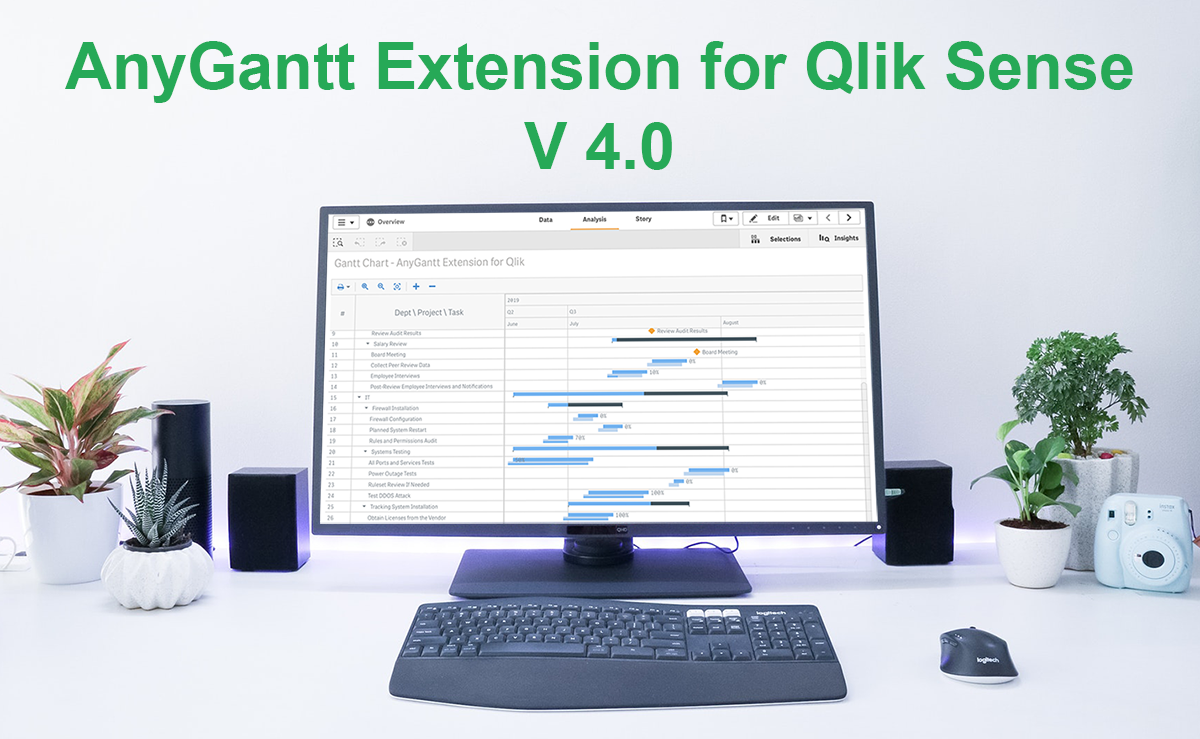 Good news, Qlikkies! We’ve released a major update to our Qlik Sense Gantt chart extension AnyGantt, bringing a bunch of new awesome features to further improve your project and resource data visualization experience using it. Look what’s new in version 4.0!
Read more at qlik.anychart.com »
- Categories: AnyChart charting component, AnyGantt, News, Qlik
- No Comments »
How to Create Gantt Chart in Qlik Sense Using AnyGantt Extension for Smart Project Data Visualization
September 11th, 2019 by AnyChart Team Looking for the simplest way to create a Gantt chart in Qlik Sense to further streamline data-driven project management in your company or organization? We’ll show you one right now! Follow this quick tutorial and you’ll learn how to easily visualize project tasks and activities as data in a matter of minutes — on smart, interactive Gantt charts using the intuitive AnyGantt extension for Qlik by AnyChart.
Watch the video tutorial or follow the text-and-pictures version — you choose!
Read more at qlik.anychart.com »
- Categories: AnyChart charting component, AnyGantt, Big Data, Business Intelligence, Gantt Chart, Qlik
- 3 Comments »
Create Simple Gantt Chart Using JavaScript — Tutorial
September 4th, 2019 by Alfrick Opidi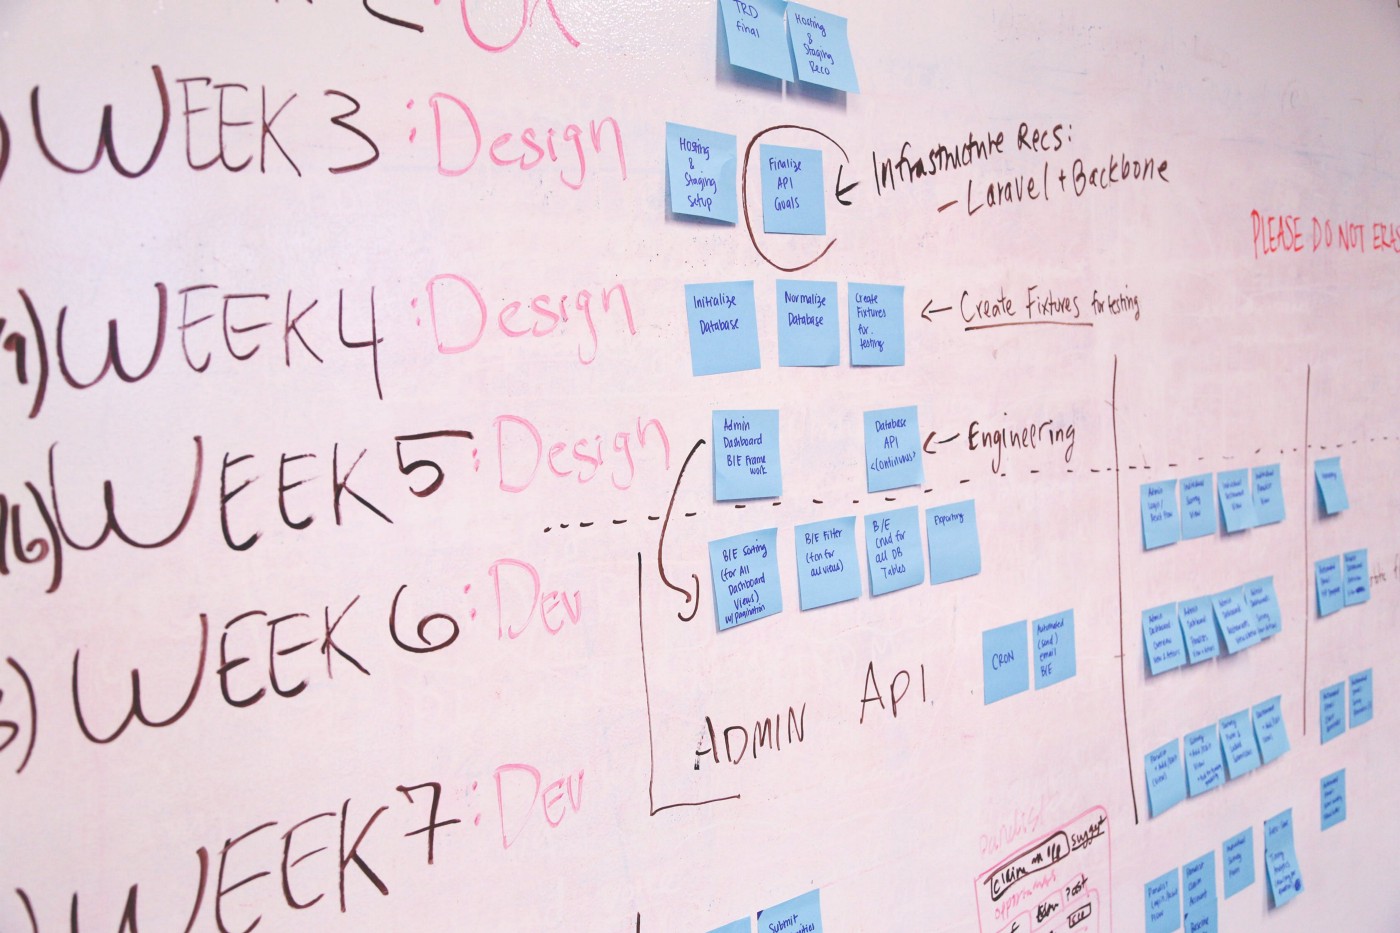
Use a JavaScript library to create a Gantt chart and take your project management efforts to the next level.
Earlier this year, my team was looking for a project management tool that could assist us in charting the various tasks related to our app development project against some specific timelines. After doing some research, we finally settled on Gantt charts. However, some people think Gantts are complicated to create. Not true! Thanks to numerous JavaScript chart libraries, data visualization is now simple, flexible, and embeddable.
In our situation, we settled on AnyChart’s JS Charts library because of its ease of use, extensive documentation, flexible code playground for trying out stuff, and other powerful features.
In this tutorial, I’ll walk you through how to create a simple interactive Gantt chart using this data visualization library. Here’s what we’ll be making and you can get the entire code for creating such a Gantt chart at the end of the tutorial:

Read the JS charting tutorial »
- Categories: AnyChart charting component, AnyGantt, Big Data, Business Intelligence, Gantt Chart, HTML5, JavaScript, JavaScript chart tutorials, Tips and tricks
- 3 Comments »
JavaScript Graph Visualization Libraries Updated — Check Out AnyChart 8.7.0 with New Awesome Features!
August 8th, 2019 by AnyChart Team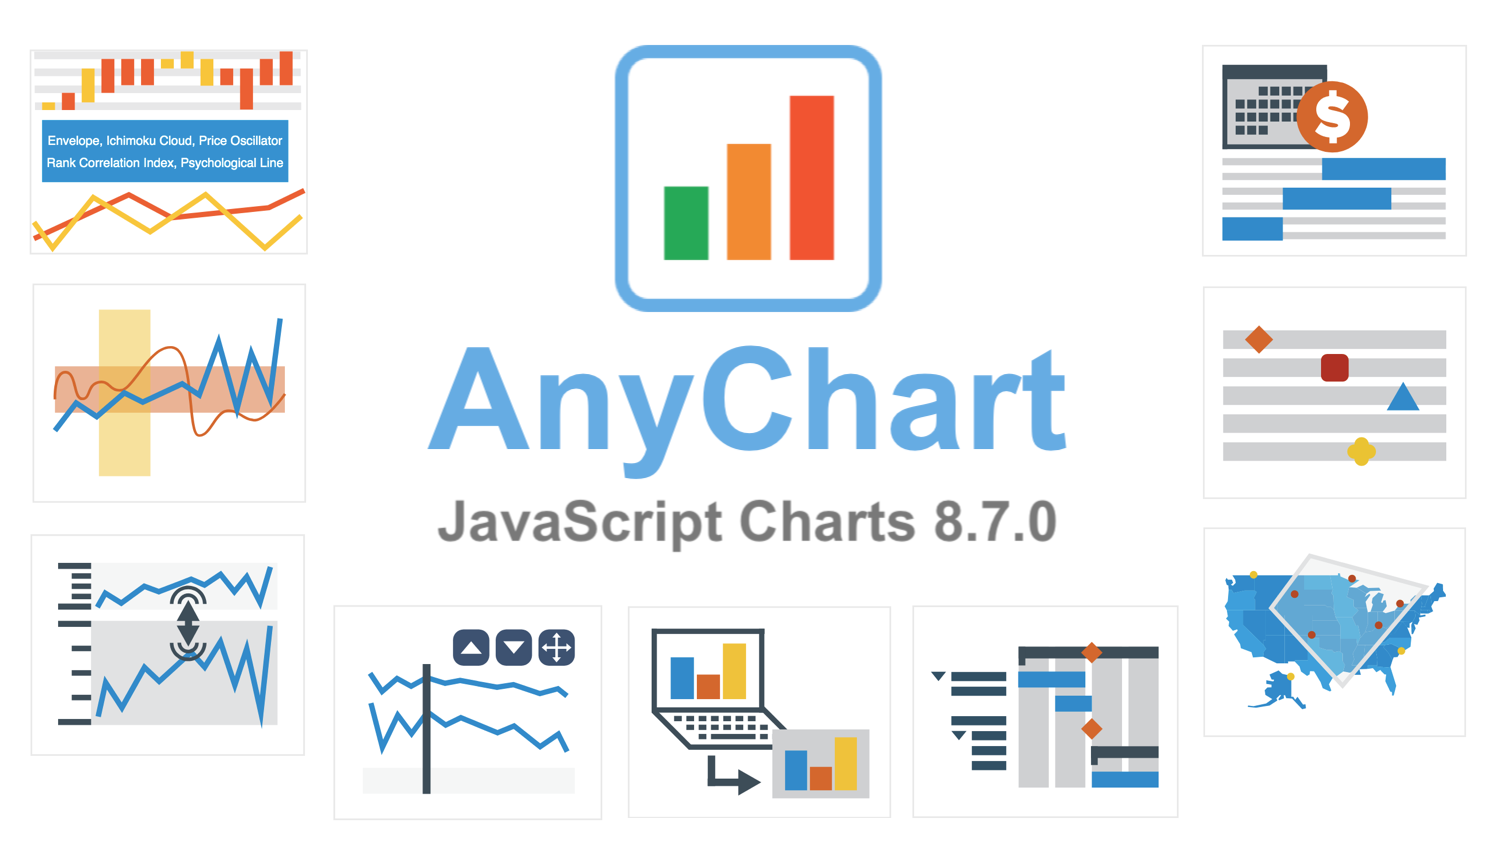 AnyChart 8.7.0 is out with a lot of new awesome data visualization features. Look what we’ve added to our JavaScript graph libraries in this major update.
»»» See What’s New in AnyChart 8.7.0! «««
- Categories: AnyChart charting component, AnyGantt, AnyMap, AnyStock, Big Data, Business Intelligence, Financial charts, Gantt Chart, HTML5, JavaScript, News, Stock charts
- 4 Comments »
All 3 Extensions for Qlik Sense Updated with New Charting Features in Version 3.4
June 19th, 2019 by AnyChart Team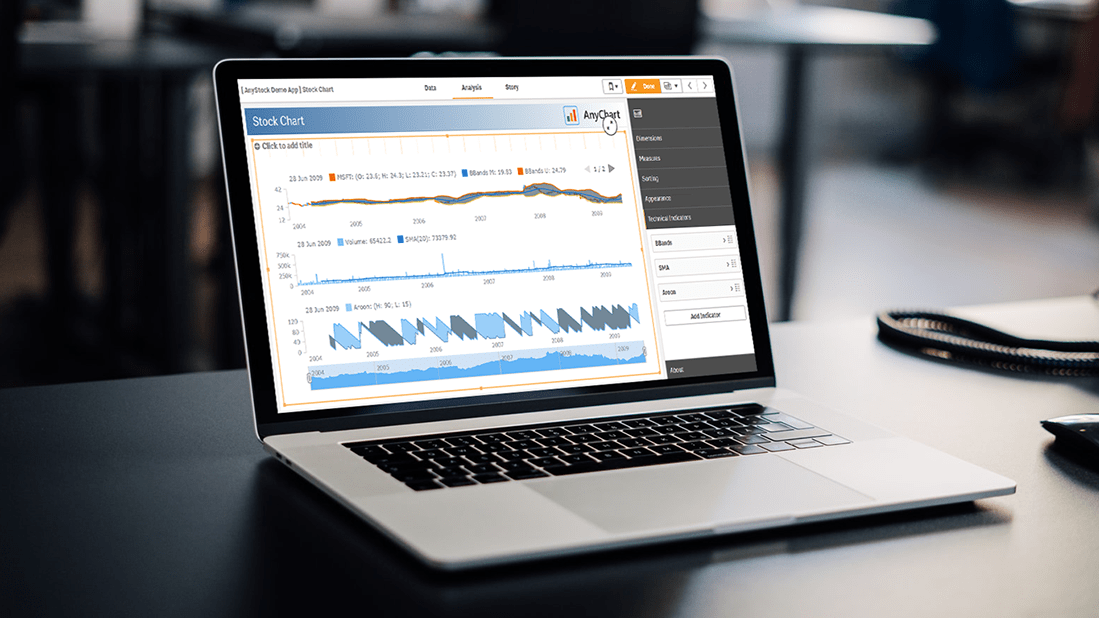 Hey Qlik users, we are happy to announce the release of version 3.4 for all our three extensions for Qlik Sense! We updated them with new awesome data visualization features and functionality such as technical indicators and more.
At last month’s Qlik Qonnections 2019 conference in Dallas where we exhibited as a new Qlik Technology Partner, we received amazing feedback from the Qlik community. We took that information and have already begun building out some of those requests for our next release of version 3.5 for our extensions for Qlik Sense, so please keep the feedback coming and we’ll keep building.
In the meantime here’s what we added.
Read more at qlik.anychart.com »
- Categories: AnyChart charting component, AnyGantt, AnyMap, AnyStock, Business Intelligence, Gantt Chart, Qlik, Stock charts
- No Comments »
JS Charts Library AnyChart Adds Timeline Chart and Network Graph in Version 8.6.0
May 15th, 2019 by AnyChart Team AnyChart 8.6.0 is out! Check out what new awesome interactive data visualization features we’ve added to our award-winning JS charts library!
First and foremost, two new chart types are now available out of the box — greet the main protagonists of the 8.6.0 release:
 |
Timeline Chart in AnyChart JS Charts LibraryTimeline Chart is used to display a set of events in chronological order. It is typically a graphic design showing a long bar labeled with dates paralleling it, and usually contemporaneous events. Look at interactive Timeline Chart examples in our gallery. Read AnyChart Docs to learn how to create a JS Timeline Chart using our library. |
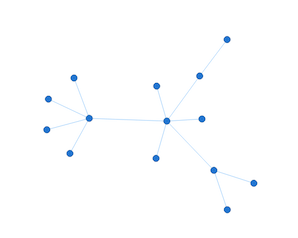 |
Network Graph in AnyChart JS Charts LibraryNetwork Graph, also Graph Chart, is a mathematical structure (graph) designed to show relationships between data points. This chart type visualizes how entities are interconnected with each other. Entities are displayed as nodes (points). Relationship between them (edges) are depicted as lines. Check out interactive Network Graph examples in our gallery. Read AnyChart docs to learn how to create a JS Network Graph using our library. |
Then, the new major release AnyChart JS Charts 8.6.0 is bringing multiple other improvements, not to mention bug fixes.
Take a look into what’s new, by product:
Let us know if you have requests for new JS chart types or data visualization features. Contact our Support Team with all your tips and suggestions, and we’ll be happy to consider quickly delivering what you need. As always, you know.
Enjoy AnyChart 8.6.0!
- Categories: AnyChart charting component, AnyGantt, AnyMap, AnyStock, HTML5, JavaScript, News
- 1 Comment »
AnyChart Joins Qlik Technology Program and Adds 36 Chart Types to Qlik Sense in Just-Launched Extensions
May 7th, 2019 by AnyChart Team“We’re excited to be partnering with AnyChart, and their extensions will provide customers with additional choices for building even more compelling visualizations.”
— Mike Foster, Vice President, Strategic Partners at Qlik.
(Source: press release as of May 7, 2019.)
AnyChart crosses a new frontier! The vast data visualization capabilities of our award-winning JavaScript charting library, designed primarily for web developers and software engineers, are now available directly to data analysts and BI experts through powerful, flexible, intuitive extensions for Qlik Sense — AnyChart, AnyGantt, and AnyStock!
Read more at qlik.anychart.com »
- Categories: AnyChart charting component, AnyGantt, AnyStock, Big Data, Business Intelligence, Qlik
- 13 Comments »
JavaScript Data Visualization Libraries Updated with New Features — Meet AnyChart JS Charts 8.5.0
December 25th, 2018 by AnyChart Team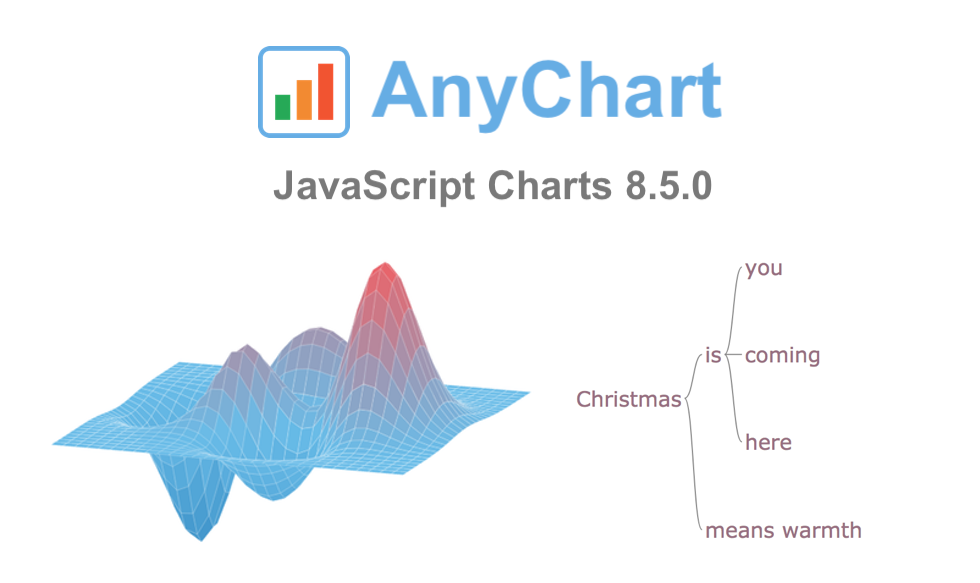 On this wonderful day, we are excited to announce a new major update for our JavaScript data visualization libraries: AnyChart 8.5.0 is released!
The new version brings a lot of advanced features and improvements that make our JS (HTML5) charting solutions even more powerful. 3D Surface Plot, Word Tree, and much more — spare a minute to look through the highlights of the 8.5.0 release of AnyChart, AnyStock, AnyGantt, and AnyMap.
- Categories: AnyChart charting component, AnyGantt, AnyMap, AnyStock, HTML5, JavaScript, News
- 1 Comment »
JS Sankey Diagram and Other Improvements in AnyChart 8.4.0 Released Just Now
October 8th, 2018 by AnyChart Team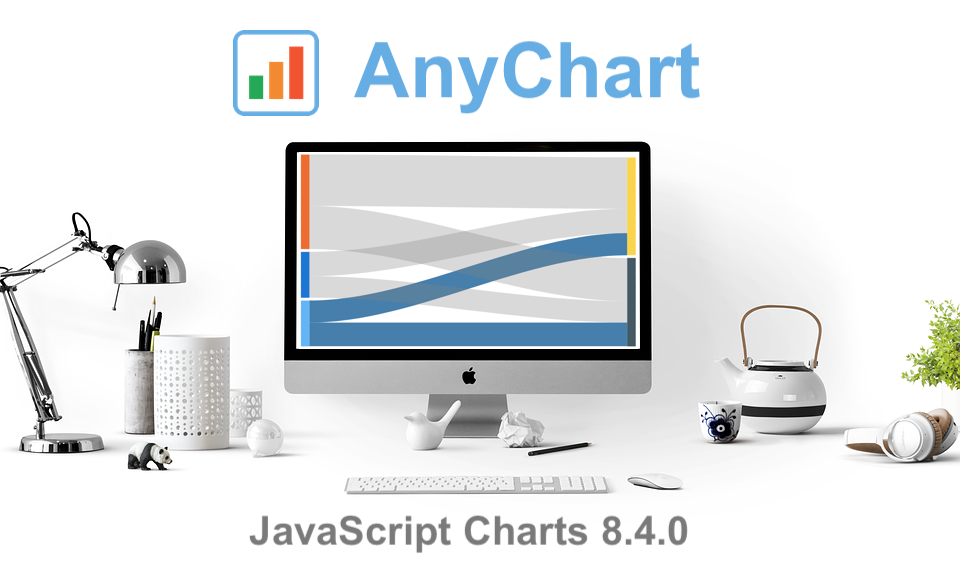 The year’s third major update for AnyChart is out, featuring the JS Sankey Diagram chart type as the ultimate centerpiece of the new release.
Learn more about AnyChart 8.4.0 and start making use of our updated JavaScript (HTML5) libraries for interactive data visualization right away.
- Categories: AnyChart charting component, AnyGantt, AnyMap, AnyStock, HTML5, JavaScript
- 1 Comment »
JS Chart Libraries Get New Great Features in 8.3.0 Release of AnyChart, AnyStock, AnyMap and AnyGantt
July 10th, 2018 by AnyChart Team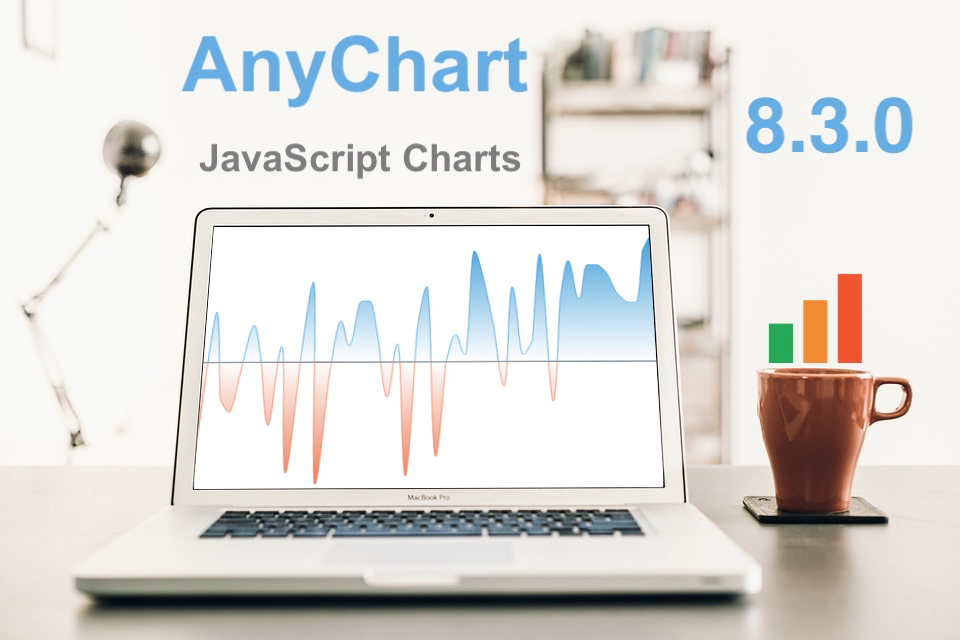 We at AnyChart are proud to announce the 8.3.0 release of our JS chart libraries AnyChart, AnyStock, AnyGantt, and AnyMap! The present major update brings full support of HTML in tooltips, background settings for chart data bounds, coloring rules and thresholds, easy axis label positioning, new technical indicators, and even more.
- Categories: AnyChart charting component, AnyGantt, AnyMap, AnyStock, Financial charts, Gantt Chart, HTML5, JavaScript, News, Stock charts
- 6 Comments »
