Qlik Charts Updated to Version 2.4.0, Now with Multiple Scales, Localizations, and More
June 14th, 2018 by AnyChart Team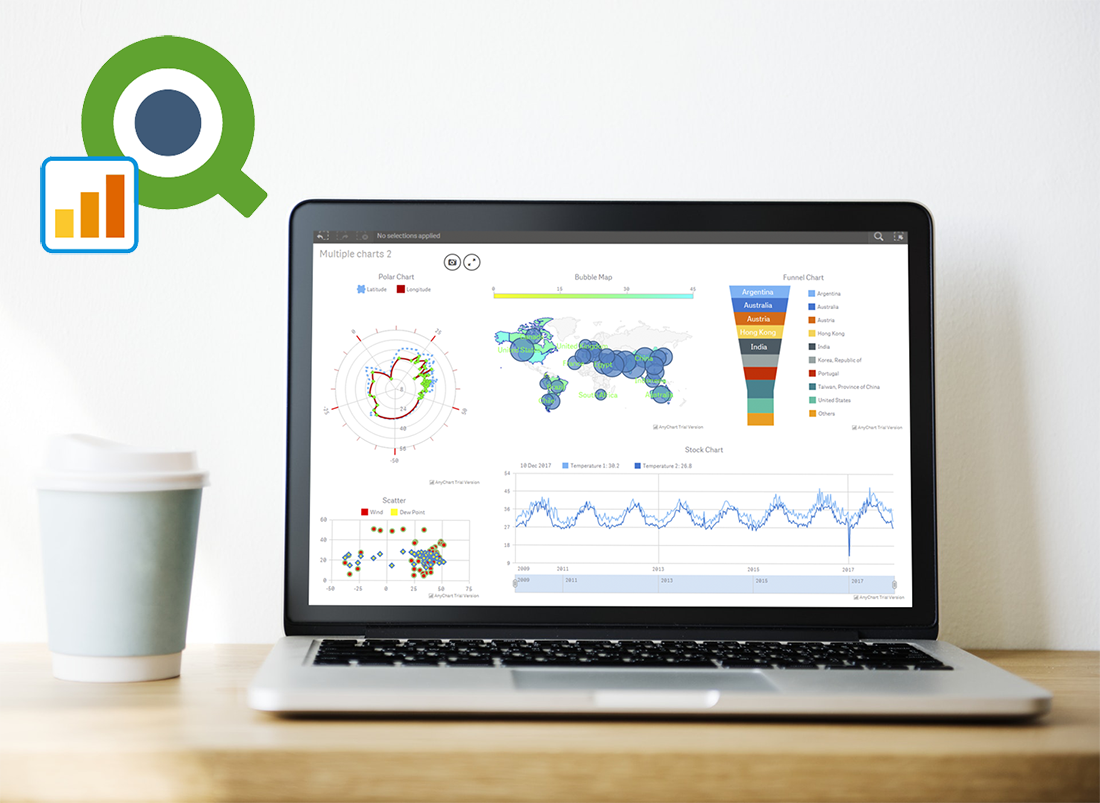 Great news for Qlik users! We’ve released version 2.4.0 of the AnyChart Qlik Extension. The latest update brings several important new features to Qlik charts: multiple scales, localization support, coloring controls for OHLC, candlestick and waterfall charts, as well as label rotation settings.
Learn more about the new version of our JavaScript (HTML5) charting library extension for interactive data visualization on Qlik data analytics platform, and what’s next in our plans.
- Categories: AnyChart Charting Component, HTML5, JavaScript, News, Qlik
- No Comments »
Regression Analysis in AnyChart JavaScript Charts
May 29th, 2018 by Irina Maximova
AnyChart is not only a beautiful charting library but also a multifunctional one. We’ve got lots of questions from our customers on how they can integrate regression analysis into AnyChart JavaScript Charts. There are many approaches that may be adopted in order to interpolate and approximate data. And the one we’re going to share with you today involves the use of the popular regression.js library along with AnyChart.
- Categories: AnyChart Charting Component, HTML5, JavaScript, News, Tips and Tricks
- 1 Comment »
AnyChart Qlik Sense Extension 2.3.0 Released Featuring Linear and Circular Gauges
March 8th, 2018 by AnyChart Team Less than four months have passed since we presented version 2.0 of our Qlik Sense extension for advanced data visualization. During that short time period, we released three more updates: 2.0.1, 2.1.0 and 2.2.0. And here’s a new one ready!
The latest update adds two new chart types – Linear and Circular Gauges – as well as several new important features, further extending the power of our JavaScript charting libraries to the Qlik Sense environment. Check out the details in a quick overview below.
- Categories: AnyChart Charting Component, HTML5, JavaScript, News, Qlik
- No Comments »
Best JavaScript Technology: AnyChart JS Charts Library Wins 2018 DEVIES Award!
February 6th, 2018 by AnyChart Team It’s happened! Our AnyChart JS Charts library has just been officially named the best in JavaScript Technology for innovation and received a prestigious DEVIES award in California! (See all the 2018 DEVIES winners — one for each of the 15 categories.)
2018 DEVIES is reported to be the world’s leading DevTech Awards event, taking place these days during DeveloperWeek in Oakland, CA, the largest developer expo and conference series globally.
- Categories: AnyChart Charting Component, AnyGantt, AnyMap, AnyStock, HTML5, JavaScript, News, Qlik, Success Stories
- 6 Comments »
Happy New Year in JavaScript Charting: AnyChart 8.1.0 Is Out!
December 20th, 2017 by AnyChart Team The New Year and Christmas are already just around the corner, and we have something astonishing for you in this magical time! The next major update for our product family of JavaScript charting libraries is now released, so meet AnyChart 8.1.0!
Check out what new cool and useful features are delivered in the new versions of our HTML5-based interactive data visualization solutions AnyChart, AnyStock, AnyGantt and AnyMap, as well as what we are going to work on next.
- Categories: AnyChart Charting Component, AnyGantt, AnyMap, AnyStock, Financial Charts, Gantt Chart, HTML5, JavaScript, News, Qlik, Stock Charts
- 2 Comments »
Android Charts Made Easy – Meet AnyChart Library for Data Visualization in Android Apps!
November 21st, 2017 by AnyChart Team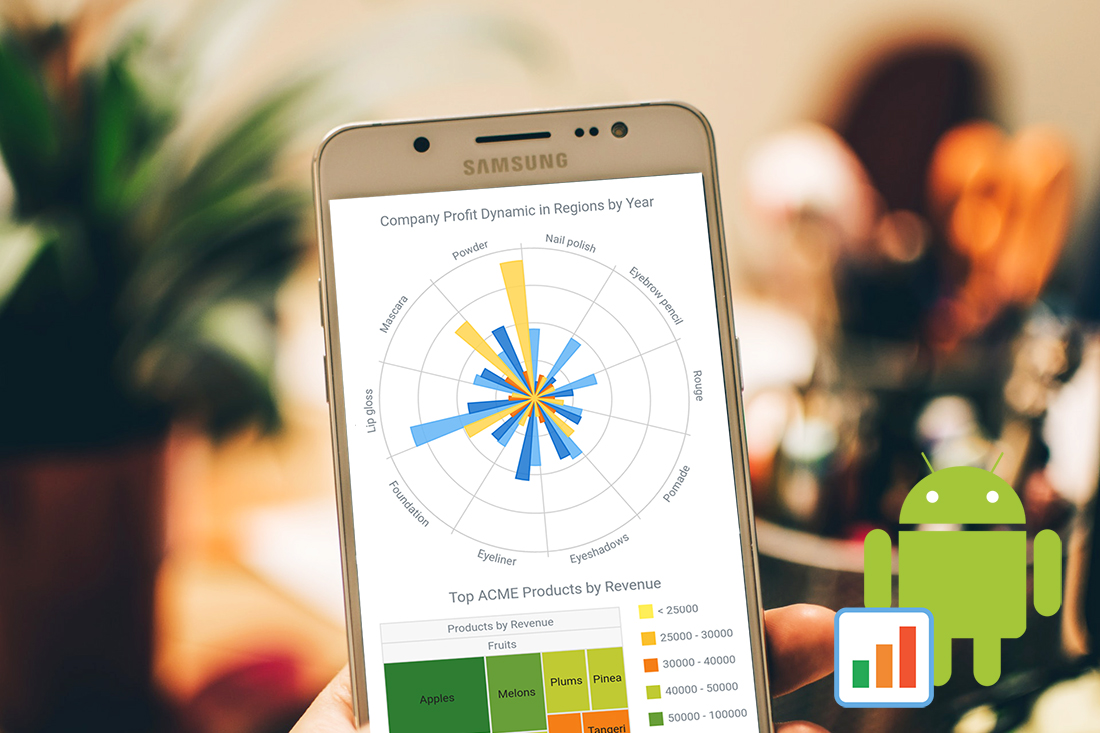 Android app developers can now use AnyChart Java wrapper to run our interactive data visualization solutions in native Android apps! Meet AnyChart Android Charts!
It’s a stunning data visualization library for making interactive HTML5 charts in Android apps, running on API 14+ (Android 4.0). AnyChart supplies dozens of different chart types and seamlessly works with any data from any database.
- Categories: AnyChart Charting Component, HTML5, News, Tips and Tricks
- 12 Comments »
AnyChart Extension 2.0 for Qlik Sense Released, Fueling Flexibility in Data Visualization
November 15th, 2017 by AnyChart Team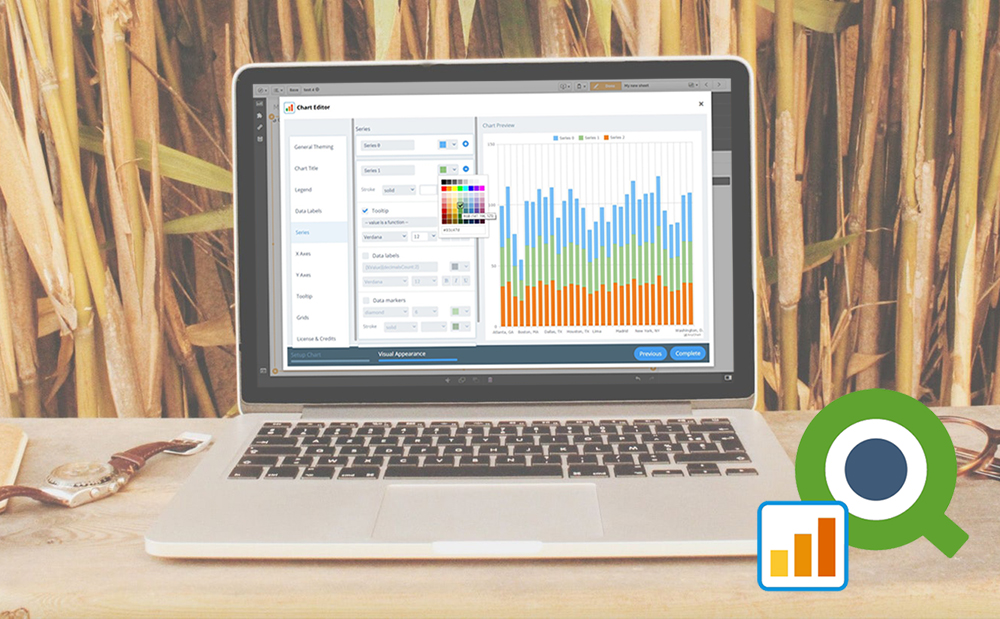 When AnyChart JS Charts‘ dedicated extension for Qlik Sense first hit the stage on Qlik Branch in the spring of 2017, it was well received by the community. In fact, we delivered what many Qlik users craved: advanced flexibility which at the same time would not affect the ease of interactive data visualization. And that was just the beginning.
Now, we are happy to present version 2.0 of our extension for Qlik Sense!
The major update has brought new chart types and elaborate features out of the box, sharing another portion of the ultimate data visualization power inherent in the AnyChart JavaScript charting library with Qlik users.
- Categories: AnyChart Charting Component, Business Intelligence, HTML5, News, Qlik
- 1 Comment »
Modular JavaScript Charting: AnyChart 8 Premiere
October 2nd, 2017 by AnyChart Team Fall is an amazing time for TV, movie, theater, and other art lovers as that’s when a lot of premieres are being launched. Well, we are happy to contribute to the debut mainstream this time! Meet AnyChart 8, a modular JavaScript charting system taking the convenience, performance, and customization in the art of interactive data visualization to the next level.
Join us in reviewing the core innovations delivered in the 8th, module-based generation of AnyChart, including the brand new features now available in our JS charting libraries AnyChart, AnyStock, AnyGantt, and AnyMap, as well as what else is in our nearest plans.
AnyChart JS Charts 8.0.0: Modules, Custom Builds, and Much More
The 8.0.0 release of the AnyChart, AnyGantt, AnyMap, and AnyStock JavaScript (HTML5) charting libraries delivers a lot of brand new features and technical improvements. Please see the list below for a quick overview of what’s new.
- Categories: AnyChart Charting Component, AnyGantt, AnyMap, AnyStock, Dashboards, Financial Charts, Gantt Chart, HTML5, JavaScript, News, Stock Charts
- 5 Comments »
AnyChart JavaScript Charting Libraries 7.14.0 Released: Can’t Stop Perfecting Data Visualization!
May 30th, 2017 by AnyChart Team![]() Here are the spring May flowers we promised. After the hard work put in over the past months, we’re happy to announce that the 7.14.0 release of our JavaScript charting libraries AnyChart, AnyStock, AnyMap, and AnyGantt is out and ready to download! It brings you new cool features and important improvements that will make your data visualization life even better.
Here are the spring May flowers we promised. After the hard work put in over the past months, we’re happy to announce that the 7.14.0 release of our JavaScript charting libraries AnyChart, AnyStock, AnyMap, and AnyGantt is out and ready to download! It brings you new cool features and important improvements that will make your data visualization life even better.
Now, we invite you to discover all the new JavaScript/HTML5 charting capabilities that the 7.14.0 version of AnyChart’s data visualization software product family has to offer to you. Here’s a quick overview…
- Categories: AnyChart Charting Component, AnyGantt, AnyMap, AnyStock, Business Intelligence, Dashboards, Financial Charts, Gantt Chart, HTML5, JavaScript, News, Stock Charts
- 7 Comments »
JavaScript Charts Library Update 7.13.1 Released for AnyChart, AnyStock, AnyMap, AnyGantt
April 18th, 2017 by AnyChart Team “Sweet April showers do spring May flowers,” once wrote 16th-century English poet Thomas Tusser. Well, our customers already know that AnyChart’s April brings flowers, too! Last year we launched the great 7.10.0 version of the AnyChart JavaScript charts library and, basically, of our whole data visualization product family. Now, in the year of 2017, April brings you another great update.
So, please all greet the 7.13.1 release of AnyChart, AnyMap, AnyStock, and AnyGantt – our cute first spring flowers grown especially for you!
- Categories: AnyChart Charting Component, AnyGantt, AnyMap, AnyStock, HTML5, JavaScript, News, Qlik
- 2 Comments »