Creating Heat Map Chart Using JavaScript
February 26th, 2020 by Anastasia Zoumpliou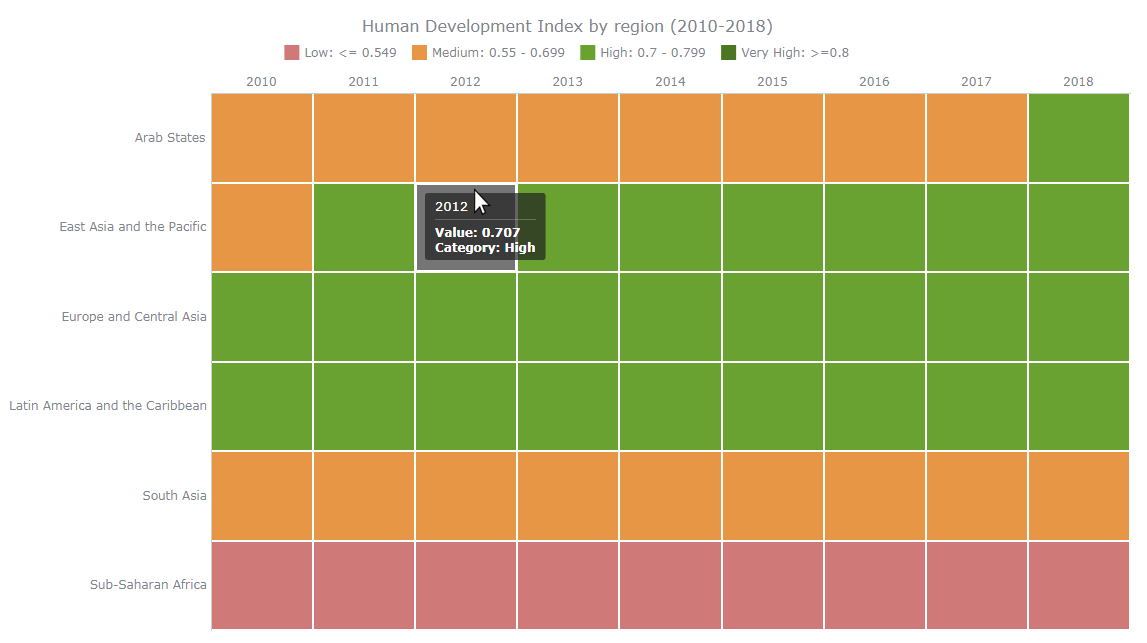 Want to learn how to quickly create an interactive heat map chart using JavaScript? This data visualization tutorial will guide you through the coding process step by step. Basic knowledge of HTML (HTML5) and some understanding of programming are more than enough to master this charting technique.
A heat map (or heatmap chart) is a two-dimensional, matrix-based data visualization in which colors represent values. It is often used to facilitate the analysis of complex data sets, revealing patterns in how variables change, correlate, and more.
Read this JS charting tutorial to the end and you will have no more problems with getting compelling heat maps up and running on your web sites and in your apps.
Read the JS charting tutorial »
- Categories: AnyChart Charting Component, Big Data, Business Intelligence, HTML5, JavaScript, JavaScript Chart Tutorials, Tips and Tricks
- 1 Comment »
AnyChart JS Charts 8.7.1 Is Ready for Download — Enjoy New Version!
January 28th, 2020 by AnyChart Team Our JavaScript charting libraries are now updated! Just before the new year, we delivered important fixes and improvements to them in version 8.7.1. These updates make it even better to visualize data using our flexible visualization solutions for cross-platform HTML5 charting — AnyChart JS for basic charts, AnyGantt JS for project and resource charts, AnyStock JS for stock and any other time-series charts, and AnyMap JS for geographical and seat map charts.
Download version 8.7.1 now and start enjoying our updated JavaScript charting libraries!
Check the version history of the library you are using to see exactly what has been improved and fixed in the new release:
Let us know what else we should add or enhance. We’ve been always listening to you and your feedback has always largely determined our roadmap. Of course, this will remain so in the new year (and beyond). Any questions, give us a shout and we’ll be happy to assist you asap.
We wish you a happy and prosperous 2020!
- Categories: AnyChart Charting Component, AnyGantt, AnyMap, AnyStock, Big Data, Business Intelligence, Dashboards, Financial Charts, Gantt Chart, HTML5, JavaScript, News, Stock Charts
- No Comments »
AnyChart Recognized in Top 10 Business Intelligence and Analytics Companies of 2019
November 19th, 2019 by AnyChart Team We are excited to announce that Analytics Insight, a magazine that covers big data and business intelligence developments, included AnyChart in The 10 Next Generation BI and Analytics Companies of 2019 — “for providing the most advanced solutions and playing a significant role in shaping the future of these disruptive technologies.”
The list has been made public in the just-released November issue of the magazine and is accompanied by the stories about each featured company. With permission of Analytics Insight, today we are republishing the magazine’s story about us on our blog — “AnyChart: Turning Data into Actionable Insights with Award-Winning Data Visualization Solutions.”
Read the story of AnyChart as it appeared on Analytics Insight »
- Categories: AnyChart Charting Component, AnyGantt, AnyMap, AnyStock, Big Data, Business Intelligence, Charts and Art, Dashboards, Financial Charts, Flash Platform, Gantt Chart, GraphicsJS, HTML5, Interesting Facts, JavaScript, News, Success Stories
- No Comments »
Compelling Data Visualizations to Check Out This Weekend — DataViz Weekly
October 25th, 2019 by AnyChart Team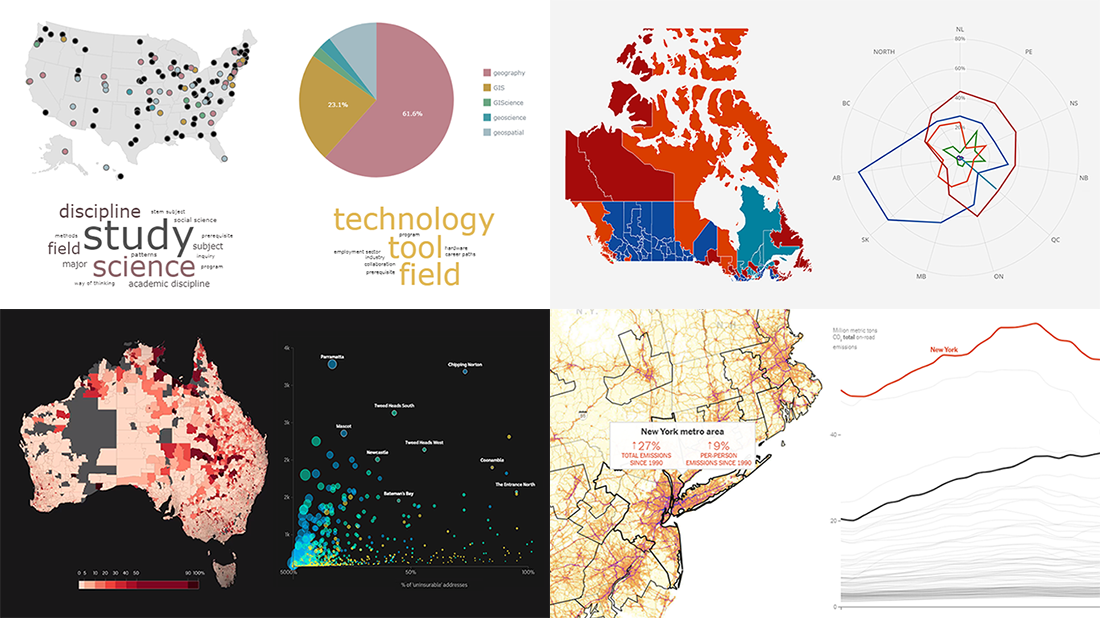 Continuing our regular DataViz Weekly feature, we invite you to check out several compelling data visualizations worth taking a look at, which we’ve noticed and enthusiastically explored these days. Here’s a quick list of the projects highlighted in the new roundup:
- Impact of climate change on the costs and availability of insurance in Australia — ABC News
- “Geography” and “GIS” in the U.S. higher education — Alicia Bradshaw, UW Tacoma
- Auto emissions in America — The New York Times
- Canadian federal election results — CBC/Radio-Canada
- Categories: Data Visualization Weekly
- No Comments »
Create Simple Gantt Chart Using JavaScript — Tutorial
September 4th, 2019 by Alfrick Opidi
Use a JavaScript library to create a Gantt chart and take your project management efforts to the next level.
Earlier this year, my team was looking for a project management tool that could assist us in charting the various tasks related to our app development project against some specific timelines. After doing some research, we finally settled on Gantt charts. However, some people think Gantts are complicated to create. Not true! Thanks to numerous JavaScript chart libraries, data visualization is now simple, flexible, and embeddable.
In our situation, we settled on AnyChart’s JS Charts library because of its ease of use, extensive documentation, flexible code playground for trying out stuff, and other powerful features.
In this tutorial, I’ll walk you through how to create a simple interactive Gantt chart using this data visualization library. Here’s what we’ll be making and you can get the entire code for creating such a Gantt chart at the end of the tutorial:
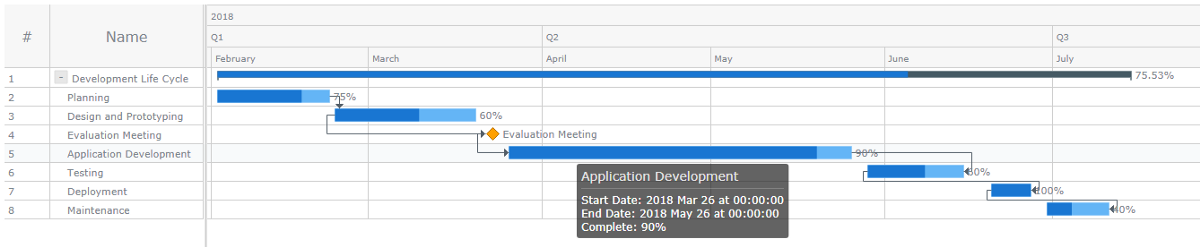
Read the JS charting tutorial »
- Categories: AnyChart Charting Component, AnyGantt, Big Data, Business Intelligence, Gantt Chart, HTML5, JavaScript, JavaScript Chart Tutorials, Tips and Tricks
- 3 Comments »
Devon County Council Uses AnyChart JS Charts for Health Data Visualization
August 29th, 2019 by AnyChart Team As a globally leading, award-winning data visualization solution, our JavaScript charting library is used not only in commercial apps but also by governments of all levels worldwide. Devon County Council, a UK local authority administering the English county of Devon, is one such customer.
In particular, Mark Painter from Devon County Council’s Community and Public Health Intelligence Team told us they use AnyChart to generate all the charts in their Health and Wellbeing Profiles. We’ve interviewed him to learn more. (Stack: WordPress/CSV.)
- Categories: AnyChart Charting Component, Success Stories
- No Comments »
AnyChart CEO Anton Baranchuk Named One of Most Promising CEOs of 2019
August 13th, 2019 by AnyChart Team Insights Success magazine has named Anton Baranchuk, CEO and Co-founder of AnyChart, one of The Most Promising CEOs of 2019. Celebrating this exciting recognition, we are pleased to share with you a special article about him and our company. Published in the latest issue of Insights Success, the story is based on Anton’s recent interview with the magazine. Take a read.
- Categories: AnyChart Charting Component, News, Success Stories
- No Comments »
JavaScript Graph Visualization Libraries Updated — Check Out AnyChart 8.7.0 with New Awesome Features!
August 8th, 2019 by AnyChart Team AnyChart 8.7.0 is out with a lot of new awesome data visualization features. Look what we’ve added to our JavaScript graph libraries in this major update.
»»» See What’s New in AnyChart 8.7.0! «««
- Categories: AnyChart Charting Component, AnyGantt, AnyMap, AnyStock, Big Data, Business Intelligence, Financial Charts, Gantt Chart, HTML5, JavaScript, News, Stock Charts
- 4 Comments »
Creating Treemap Chart Using JavaScript
August 1st, 2019 by Douglas "Bugggster" Baxter Treemap is a popular chart type for hierarchical data visualization. I’ll show you how to create a cool interactive treemap chart using JavaScript in four simple steps right now. Join me on this quick tutorial for front-end web developers and data viz enthusiasts to understand the core principles of the process. Basically, I am sure everyone at least a little familiar with coding in HTML5 will love the presented, easy way to make beautiful JavaScript treemap charts that are perfectly suitable to be embedded into any web page or app.
In honor of World Wide Web Day celebrated today, August 1, I will develop a JS treemap visualizing data about the number of worldwide internet users as of January 2019, by region, available on Statista.
Read the JS charting tutorial »
- Categories: AnyChart Charting Component, HTML5, JavaScript, JavaScript Chart Tutorials, Tips and Tricks
- 2 Comments »
AnyChart’s Co-Founder Timothy Loginov Named Top Creative Leader Innovating in Business 2019
June 24th, 2019 by AnyChart Team Business magazine Insights Success featured AnyChart‘s co-founder Timothy Loginov as one of the Top Creative Leaders Innovating in Business 2019! Today we are republishing an engaging two-page article that illuminates his journey from a freelance technical writer to a successful tech entrepreneur, outlines how our company has developed into a global leader in data visualization tools, and summarizes meaningful lessons and tips for emerging entrepreneurs.
- Categories: AnyChart Charting Component, News, Success Stories
- No Comments »