 Want to learn how to quickly create an interactive heat map chart using JavaScript? This data visualization tutorial will guide you through the coding process step by step. Basic knowledge of HTML (HTML5) and some understanding of programming are more than enough to master this charting technique.
A heat map (or heatmap chart) is a two-dimensional, matrix-based data visualization in which colors represent values. It is often used to facilitate the analysis of complex data sets, revealing patterns in how variables change, correlate, and more.
Read this JS charting tutorial to the end and you will have no more problems with getting compelling heat maps up and running on your web sites and in your apps.
How to Make JavaScript Heat Map Chart
Building any type of JS chart only takes the following four general steps:
- Create an HTML page where a chart will be displayed.
- Include all necessary JavaScript files.
- Load the data.
- Write the JavaScript code for the chart.
Let’s see each of them in detail.
Step 1: Create an HTML page
The first thing you need to do is to create a basic HTML page where you will put a relevant title and an HTML block element (e.g. <div>) to place the chart. Here, the id has the value container, but feel free to use whatever makes sense to you. The page should look like this:
<!DOCTYPE html>
<html>
  <head>
    <title>Basic JavaScript Heat Map Chart</title>
    <style>
      html, body, #container {
        width: 100%;
        height: 100%;
        margin: 0;
        padding: 0;
      }
    </style>
  </head>
  <body>
    <div id="container"></div>
  </body>
</html>
The width and height parameters inside the <style> block define the space the chart will occupy and you can change these according to your needs. The way they are set here makes the heat map occupy the entire space.
Step 2: Include all necessary files
Next, inside the <head> section of the HTML page, you should reference all the necessary script files.
There are multiple JavaScript libraries out there, providing pre-written JS code that enables developers to visualize data in a more or less straightforward way. To build heat map charts along this tutorial, I will be using the AnyChart JS charting library. It is flexible, yet easy to get started with and integrate.
When using AnyChart, you have two options of how you can get the necessary scripts:
Here, I will go with the CDN links. AnyChart features a modular system, and making a JS heat map requires the use of the core and the dedicated heat map scripts. The basic code implementation can look like this:
<!DOCTYPE html>
<html>
  <head>
    <title>Basic JavaScript Heat Map Chart</title>
    <script src="https://cdn.anychart.com/releases/8.7.1/js/anychart-core.min.js"></script>
    <script src="https://cdn.anychart.com/releases/8.7.1/js/anychart-heatmap.min.js"></script>
    <style>
      html, body, #container {
        width: 100%;
        height: 100%;
        margin: 0;
        padding: 0;
      }
    </style>
  </head>
  <body>
    <div id="container"></div>
    <script>
      <!-- The heat map code goes here -->
    </script>
  </body>
</html>
The <script> tag in the <body> section is where the heat map chart’s JavaScript code will go.
Step 3: Load the data
It’s time for data!
In this tutorial, I will visualize the Human Development Index (HDI) data from the United Nations Development Programme (UNDP) to observe the change in the HDI of six macroregions — Arab States, East Asia and the Pacific, Europe and Central Asia, Latin America and the Caribbean, South Asia, and Sub-Saharan Africa — from 2010 to 2018.
To create a heat map, three data fields are required:
x, where column names are set,y, where row names are set, andheat, where values are set.
The resulting data will look as follows:
var data = [
  { x: "2010", y: "Arab States", heat: 0.676 },
  { x: "2010", y: "East Asia and the Pacific", heat: 0.691 },
  { x: "2010", y: "Europe and Central Asia", heat: 0.735 },
  { x: "2010", y: "Latin America and the Caribbean", heat: 0.731 },
  { x: "2010", y: "South Asia", heat: 0.585 },
  { x: "2010", y: "Sub-Saharan Africa", heat: 0.498 },
  { x: "2011", y: "Arab States", heat: 0.681 },
  { x: "2011", y: "East Asia and the Pacific", heat: 0.700 },
  { x: "2011", y: "Europe and Central Asia", heat: 0.744 },
  { x: "2011", y: "Latin America and the Caribbean", heat: 0.737 },
  { x: "2011", y: "South Asia", heat: 0.593 },
  { x: "2011", y: "Sub-Saharan Africa", heat: 0.505 },
  { x: "2012", y: "Arab States", heat: 0.687 },
  { x: "2012", y: "East Asia and the Pacific", heat: 0.707 },
  { x: "2012", y: "Europe and Central Asia", heat: 0.750 },
  { x: "2012", y: "Latin America and the Caribbean", heat: 0.740 },
  { x: "2012", y: "South Asia", heat: 0.601 },
  { x: "2012", y: "Sub-Saharan Africa", heat: 0.512 },
  { x: "2013", y: "Arab States", heat: 0.688 },
  { x: "2013", y: "East Asia and the Pacific", heat: 0.714 },
  { x: "2013", y: "Europe and Central Asia", heat: 0.759 },
  { x: "2013", y: "Latin America and the Caribbean", heat: 0.748 },
  { x: "2013", y: "South Asia", heat: 0.607 },
  { x: "2013", y: "Sub-Saharan Africa", heat: 0.521 },
  { x: "2014", y: "Arab States", heat: 0.691 },
  { x: "2014", y: "East Asia and the Pacific", heat: 0.721 },
  { x: "2014", y: "Europe and Central Asia", heat: 0.766 },
  { x: "2014", y: "Latin America and the Caribbean", heat: 0.752 },
  { x: "2014", y: "South Asia", heat: 0.617 },
  { x: "2014", y: "Sub-Saharan Africa", heat: 0.527 },
  { x: "2015", y: "Arab States", heat: 0.695 },
  { x: "2015", y: "East Asia and the Pacific", heat: 0.727 },
  { x: "2015", y: "Europe and Central Asia", heat: 0.770 },
  { x: "2015", y: "Latin America and the Caribbean", heat: 0.754 },
  { x: "2015", y: "South Asia", heat: 0.624 },
  { x: "2015", y: "Sub-Saharan Africa", heat: 0.532 },
  { x: "2016", y: "Arab States", heat: 0.699 },
  { x: "2016", y: "East Asia and the Pacific", heat: 0.733 },
  { x: "2016", y: "Europe and Central Asia", heat: 0.772 },
  { x: "2016", y: "Latin America and the Caribbean", heat: 0.756 },
  { x: "2016", y: "South Asia", heat: 0.634 },
  { x: "2016", y: "Sub-Saharan Africa", heat: 0.535 },
  { x: "2017", y: "Arab States", heat: 0.699 },
  { x: "2017", y: "East Asia and the Pacific", heat: 0.733 },
  { x: "2017", y: "Europe and Central Asia", heat: 0.771 },
  { x: "2017", y: "Latin America and the Caribbean", heat: 0.758 },
  { x: "2017", y: "South Asia", heat: 0.638 },
  { x: "2017", y: "Sub-Saharan Africa", heat: 0.537 },
  { x: "2018", y: "Arab States", heat: 0.703 },
  { x: "2018", y: "East Asia and the Pacific", heat: 0.741 },
  { x: "2018", y: "Europe and Central Asia", heat: 0.779 },
  { x: "2018", y: "Latin America and the Caribbean", heat: 0.759 },
  { x: "2018", y: "South Asia", heat: 0.642 },
  { x: "2018", y: "Sub-Saharan Africa", heat: 0.541 },
];
Step 4: Write the JS Heat Map chart code
Ok, are you ready to code?
- Add the
anychart.onDocumentReadyfunction inside the<script>tag. It will include the entire core JavaScript code of the heat map chart and will be executed when the page is ready. - Add the data from step 3.
- Use
anychart.heatMap(data)to create a heat map chart visualizing the included data. - Add a relevant chart title.
- Set the container id to put the chart into it.
- Draw the chart.
Plus one important thing about the color scale. In my case, all data values are numbers less than 1. It means that AnyChart’s default ordinal scale would give us the same color in all cells. To improve the visualization and quickly apply a more appropriate cell coloring, I will use a linear scale based on two colors; the first one, #ACE8D4, will be the color for heat value 0, whereas the second color, #00726A, will be set for the maximum value. The in-between colors will be calculated automatically.
Here is the resulting code:
<!DOCTYPE html>
<html>
  <head>
    <title>Basic JavaScript Heat Map Chart</title>
    <script src="https://cdn.anychart.com/releases/8.7.1/js/anychart-core.min.js"></script>
    <script src="https://cdn.anychart.com/releases/8.7.1/js/anychart-heatmap.min.js"></script>
    <style>
      html, body, #container {
        width: 100%;
        height: 100%;
        margin: 0;
        padding: 0;
      }
    </style>
  </head>
  <body>
    <div id="container"></div>
    <script>
      anychart.onDocumentReady(function () {

        // create the data
        var data = [
          { x: "2010", y: "Arab States", heat: 0.676 },
          { x: "2010", y: "East Asia and the Pacific", heat: 0.691 },
          { x: "2010", y: "Europe and Central Asia", heat: 0.735 },
          { x: "2010", y: "Latin America and the Caribbean", heat: 0.731 },
          { x: "2010", y: "South Asia", heat: 0.585 },
          { x: "2010", y: "Sub-Saharan Africa", heat: 0.498 },
          { x: "2011", y: "Arab States", heat: 0.681 },
          { x: "2011", y: "East Asia and the Pacific", heat: 0.700 },
          { x: "2011", y: "Europe and Central Asia", heat: 0.744 },
          { x: "2011", y: "Latin America and the Caribbean", heat: 0.737 },
          { x: "2011", y: "South Asia", heat: 0.593 },
          { x: "2011", y: "Sub-Saharan Africa", heat: 0.505 },
          { x: "2012", y: "Arab States", heat: 0.687 },
          { x: "2012", y: "East Asia and the Pacific", heat: 0.707 },
          { x: "2012", y: "Europe and Central Asia", heat: 0.750 },
          { x: "2012", y: "Latin America and the Caribbean", heat: 0.740 },
          { x: "2012", y: "South Asia", heat: 0.601 },
          { x: "2012", y: "Sub-Saharan Africa", heat: 0.512 },
          { x: "2013", y: "Arab States", heat: 0.688 },
          { x: "2013", y: "East Asia and the Pacific", heat: 0.714 },
          { x: "2013", y: "Europe and Central Asia", heat: 0.759 },
          { x: "2013", y: "Latin America and the Caribbean", heat: 0.748 },
          { x: "2013", y: "South Asia", heat: 0.607 },
          { x: "2013", y: "Sub-Saharan Africa", heat: 0.521 },
          { x: "2014", y: "Arab States", heat: 0.691 },
          { x: "2014", y: "East Asia and the Pacific", heat: 0.721 },
          { x: "2014", y: "Europe and Central Asia", heat: 0.766 },
          { x: "2014", y: "Latin America and the Caribbean", heat: 0.752 },
          { x: "2014", y: "South Asia", heat: 0.617 },
          { x: "2014", y: "Sub-Saharan Africa", heat: 0.527 },
          { x: "2015", y: "Arab States", heat: 0.695 },
          { x: "2015", y: "East Asia and the Pacific", heat: 0.727 },
          { x: "2015", y: "Europe and Central Asia", heat: 0.770 },
          { x: "2015", y: "Latin America and the Caribbean", heat: 0.754 },
          { x: "2015", y: "South Asia", heat: 0.624 },
          { x: "2015", y: "Sub-Saharan Africa", heat: 0.532 },
          { x: "2016", y: "Arab States", heat: 0.699 },
          { x: "2016", y: "East Asia and the Pacific", heat: 0.733 },
          { x: "2016", y: "Europe and Central Asia", heat: 0.772 },
          { x: "2016", y: "Latin America and the Caribbean", heat: 0.756 },
          { x: "2016", y: "South Asia", heat: 0.634 },
          { x: "2016", y: "Sub-Saharan Africa", heat: 0.535 },
          { x: "2017", y: "Arab States", heat: 0.699 },
          { x: "2017", y: "East Asia and the Pacific", heat: 0.733 },
          { x: "2017", y: "Europe and Central Asia", heat: 0.771 },
          { x: "2017", y: "Latin America and the Caribbean", heat: 0.758 },
          { x: "2017", y: "South Asia", heat: 0.638 },
          { x: "2017", y: "Sub-Saharan Africa", heat: 0.537 },
          { x: "2018", y: "Arab States", heat: 0.703 },
          { x: "2018", y: "East Asia and the Pacific", heat: 0.741 },
          { x: "2018", y: "Europe and Central Asia", heat: 0.779 },
          { x: "2018", y: "Latin America and the Caribbean", heat: 0.759 },
          { x: "2018", y: "South Asia", heat: 0.642 },
          { x: "2018", y: "Sub-Saharan Africa", heat: 0.541 },
        ];

        // create the chart and set the data
        chart = anychart.heatMap(data);

        // set the chart title
        chart.title("Human Development Index by region (2010-2018)");

        // create and configure the color scale.
        var customColorScale = anychart.scales.linearColor();
        customColorScale.colors(["#ACE8D4", "#00726A"]);

        // set the color scale as the color scale of the chart
        chart.colorScale(customColorScale);

        // set the container id
        chart.container("container");

        // initiate drawing the chart
        chart.draw();

      });
    </script>
  </body>
</html>
Here’s how the basic JS heat map chart looks — it is available on AnyChart Playground where you can proceed to practice:
We can see on this chart that Sub-Saharan Africa has the lowest Human Development Index values, whereas the Europe and Central Asia region seems to have the highest. But it is not easy to see at a glance something else interesting and even clearly understand a very important, fundamental thing — is it better for a region to have a lower or higher HDI?
Well, that’s a good point to look at how it’s possible to customize a JavaScript-based heat map chart, making it provide better insight with quite little JS/HTML5 coding effort.
Customizing JS Heat Map Chart
As you see, the basic chart built just above may not be enough to effectively communicate all the data has to say. This is where customizations come into picture as changing the appearance (e.g. colors and texts) can make the chart more legible and informative for the end user.
AnyChart not only gives you the ability to easily create interactive JavaScript charts, including JS heat maps, but it also gives you freedom to change it according to your needs and taste.
Let’s do the following modifications.
- Create a new custom color scale.
- Add a legend.
- Hide labels and modify the tooltip.
Alright, let’s go!
Changing the color scale
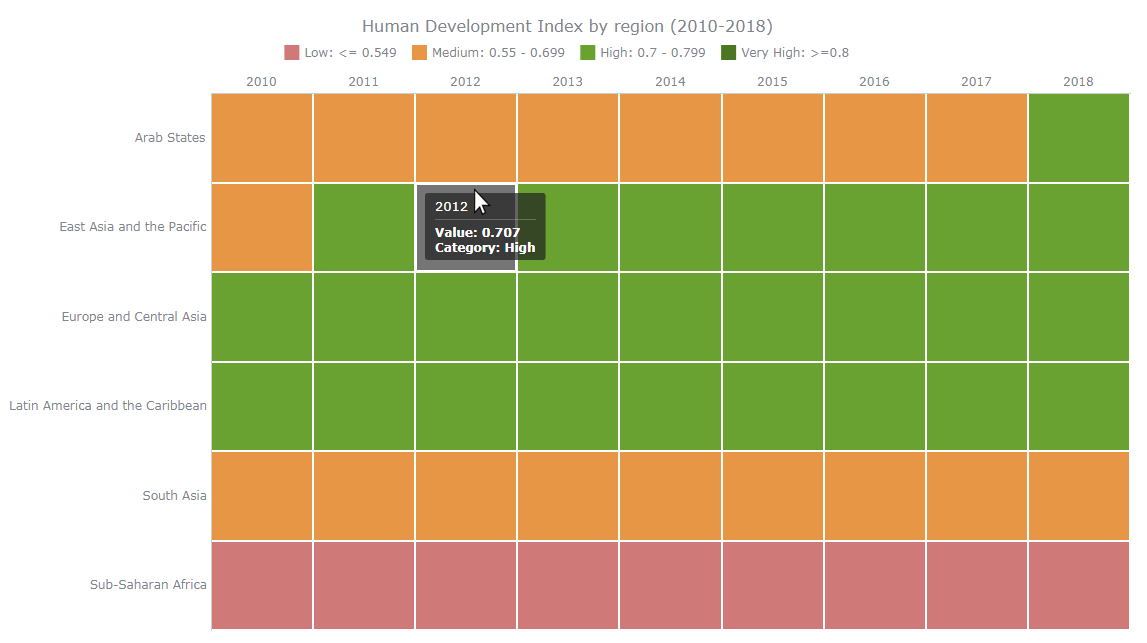
HDI has four predefined categories for value ranges — “low”, “medium”, “high” and “very high.” A higher HDI means a higher lifespan, a higher education level, and a higher gross national income per capita. To better communicate this information, let’s create a customized color scale where each color range will be encoded with a different color using an ordinal color scale.
This scale has a specific domain and color range. So now I will set each category as a domain and specify its color based on a palette similar to traffic lights.
Here, it is necessary to use the anychart.scales.ordinalColor(); constructor and then set the ranges:
var customColorScale = anychart.scales.ordinalColor();
customColorScale.ranges([
  { less: 0.549 },
  { from: 0.550, to: 0.699 },
  { from: 0.700, to: 0.799 },
  { greater: 0.800 }
]);
Then we need to specify the colors that we want to use for each range, from small to big:
customColorScale.colors(["#CF7A78", "#E69645", "#69A231", "#4D7623"]);And set the color scale as the color scale of the heat map chart:
chart.colorScale(customColorScale);Check out the result — it is also available on AnyChart Playground with the full source code:
Adding a heat map chart legend
Legends help users identify what a chart is showing. Explaining what each color and range represents, they are like manuals for the corresponding data visualizations.
To add a legend, just one simple line of code is enough:
chart.legend(true);Here’s the result — you can also find it on AnyChart Playground:
Now, you may want to change the information displayed in the legend to make it more informative. For example, here I want the range names to be displayed so the viewer can clearly understand which color encodes which range. One way to do this is to specify the names inside the color range constructor as shown below:
var customColorScale = anychart.scales.ordinalColor();
customColorScale.ranges([
  { less: 0.549, name: 'Low: <= 0.549', color: '#CF7A78' },
  { from: 0.550, to: 0.699, name: 'Medium: 0.55 - 0.699', color: '#E69645' },
  { from: 0.700, to: 0.799, name: 'High: 0.7 - 0.799', color: '#69A231' },
  { greater: 0.800, name: 'Very High: >=0.8', color: '#4D7623' }
]);
Check it out now — this example is available on AnyChart Playground as well:
Hiding labels and modifying tooltips
Labels
Finally, you can see that the heat map chart looks somewhat dense and maybe even a little confusing because of all those numbers in the cells. Colors already successfully encode the ranges, so it is possible to hide the numbers from the cells and instead display them as extra information inside the tooltip along with the range names.
It is easy to hide the numbers from the cells with just one line. Go ahead and add it:
chart.labels().enabled(false)Tooltips
When it comes to customizing heat map chart tooltips, there are many things you can do. Check out some ideas on the tooltip documentation page.
1. Let’s start with changing the tooltip position. By default, the position mode is set to float, which makes tooltips follow the cursor. I want to set the tooltip position mode to point to prevent it from moving when you hover over the cell, hoping that this step will make it easier to read the provided info.
The code for this modification is as follows:
var tooltip = chart.tooltip();
tooltip.positionMode("point");
2. Also, it is possible to change the tooltip appearance (e.g. background and text color) which is specified using CSS properties. In the CSS Classes section, you can find some examples of these properties and get ideas to apply your own styles.
Here, I will modify a CSS property named fontWeight to make the text appear bolder and, therefore, more distinct. You can either add a number value to this property (e.g. 600) or use the bold keyword:
tooltip.fontWeight(600);3. Let’s do one more modification to add some information to what is displayed in the tooltip. First, the numbers hidden from the cells will be displayed inside of the tooltip, allowing people interested in precise values to have quick access to them. Second, I want to include range names to explain the meaning of numbers.
To add all this info, let’s use an array containing these names since there is no immediate access to them from elsewhere in the code:
var categoryNames = ["Low", "Medium", "High", "Very High"]Next, I will use conditions for the ranges so that we know which name should go to which cell. To do this, I’ll take the heat value and combine it with the ranges from the color scale. Here’s the code:
tooltip.format(function () {
  if (this.heat <= 0.549) {
    return ("Value: " + this.heat + "\n Category: " + categoryNames[0]);
  }
  if (this.heat >= 0.55 && this.heat <= 0.699) {
    return ("Value: " + this.heat + "\n Category: " + categoryNames[1]);
  }
  if (this.heat >= 0.7 && this.heat <= 0.799) {
    return ("Value: " + this.heat + "\n Category: " + categoryNames[2]);
  }
});
Take note of the \n symbol in the code. It adds a line break.
For your convenience, here is the whole code for the Tooltips section:
var categoryNames = ["Low", "Medium", "High", "Very High"]

var tooltip = chart.tooltip();
tooltip.fontWeight(600);
tooltip.positionMode("point");
tooltip.format(function () {
  if (this.heat <= 0.549) {
    return ("Value: " + this.heat + "\n Category: " + categoryNames[0]);
  }
  if (this.heat >= 0.55 && this.heat <= 0.699) {
    return ("Value: " + this.heat + "\n Category: " + categoryNames[1]);
  }
  if (this.heat >= 0.7 && this.heat <= 0.799) {
    return ("Value: " + this.heat + "\n Category: " + categoryNames[2]);
  }
});
Here is the final version of the JavaScript heat map chart — check it out on AnyChart Playground where you can play with the code and visualization:
The new JS heat map looks more beautiful and informative than the initial chart, doesn’t it? Now we can clearly see that the world’s human development in terms of HDI got better over the considered period. Arab States region’s HDI and East Asia and Pacific region’s HDI improved from “medium” to “high.” None of the world regions has yet achieved the “very high” HDI value range. Sub-Saharan Africa stays in the lowest HDI range. The two regions with the highest HDIs are Europe and Central Asia, and Latin America and the Caribbean. Much better.
Conclusion
I hope my tutorial has shown that creating interactive JavaScript charts for websites and apps doesn’t have to be complicated. Using the AnyChart library, you can get a good-looking data visualization in a few minutes and then customize it to your needs also with ease.
Visit the gallery of heat maps to see more examples and get inspiration for your own creations.
- Categories: AnyChart Charting Component, Big Data, Business Intelligence, HTML5, JavaScript, JavaScript Chart Tutorials, Tips and Tricks
- 1 Comment »