Fresh Data Visuals That Impressed Us — DataViz Weekly
November 4th, 2024 by AnyChart Team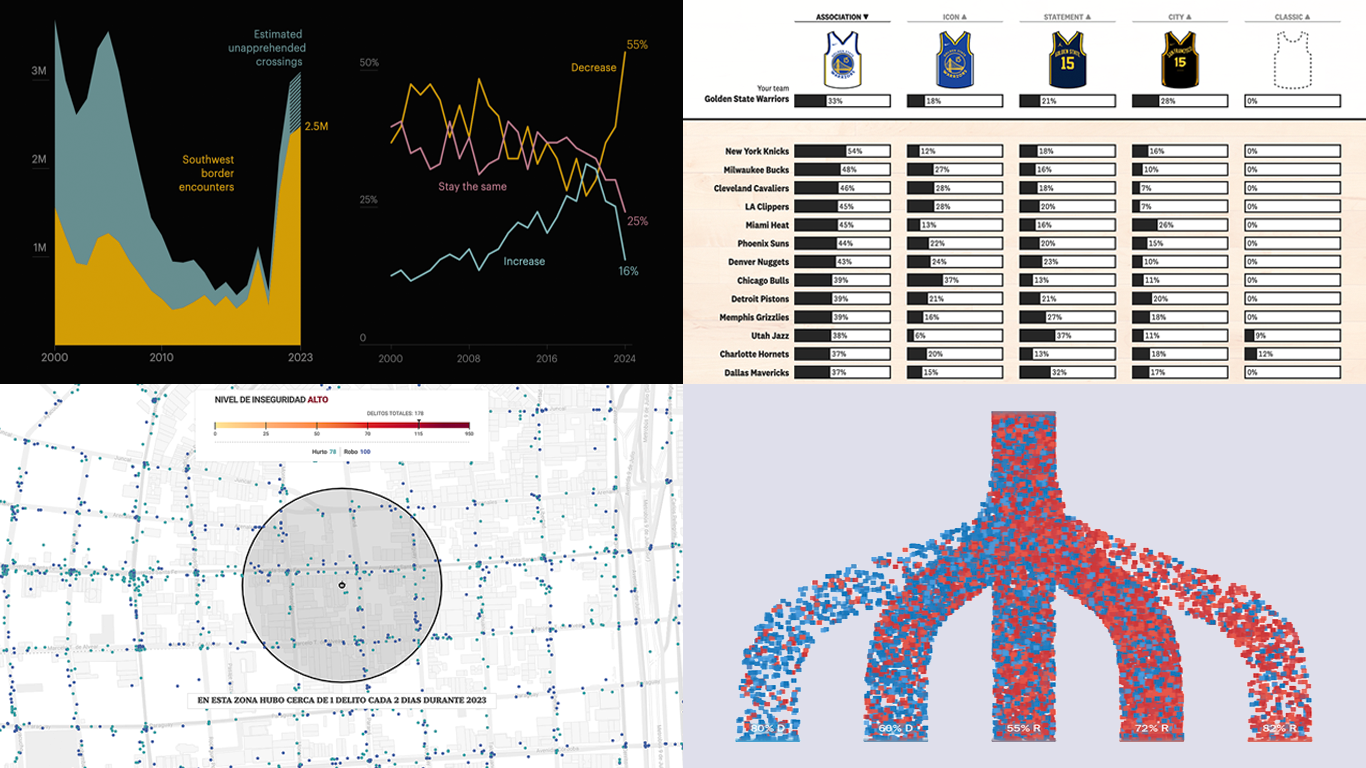 We’re a bit behind schedule after last week’s big release of updates for our Qlik Sense extensions, including the transformative AI Splits feature in the Decomposition Tree. But finally, here we are with a fresh edition of DataViz Weekly! Check out the projects with charts and maps that stood out to us most lately:
- U.S. immigration trends in historical context — ProPublica
- Crime trends in Buenos Aires — LA NACION
- Evolution of NBA uniform colors — The Pudding
- Internal migration and political polarization in the United States — The Upshot
- Categories: Data Visualization Weekly
- No Comments »
Top Data Visualizations We’ve Recently Seen — DataViz Weekly
October 18th, 2024 by AnyChart Team It’s Friday, which means it’s the perfect moment to look back at the data visualizations that have sparked our curiosity over the past few days. So, without further ado, welcome to DataViz Weekly!
- Electric vehicle adoption across the United States — FlowingData
- Europe’s military reductions and defense challenges — Bloomberg
- Climate—Conflict—Vulnerability Index for global risk assessment — UniBw München, PIK, AA, Truth & Beauty
- Campaign emails with donation incentives in the 2024 U.S. presidential race — The New York Times
- Categories: Data Visualization Weekly
- No Comments »
Impressive New Data Visuals for Your Inspiration — DataViz Weekly
October 11th, 2024 by AnyChart Team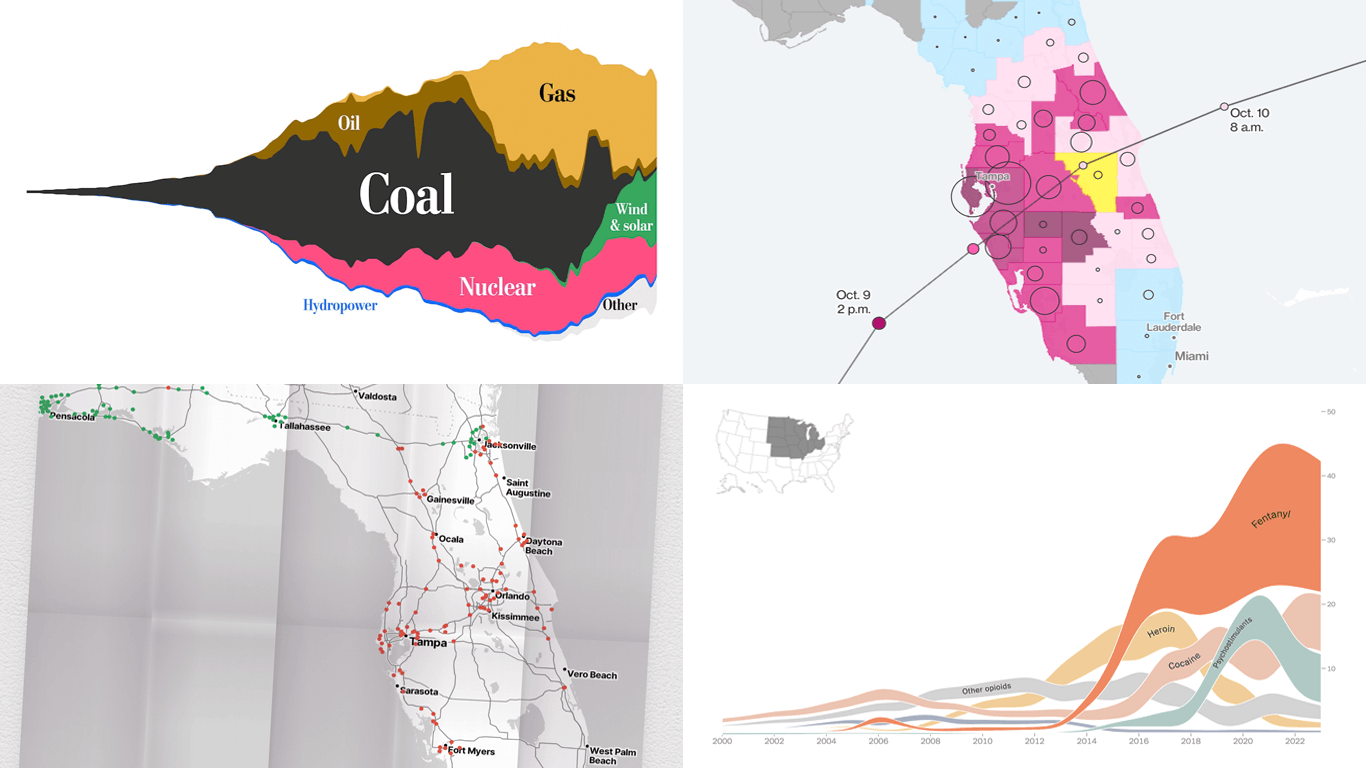 Ready for another dose of impressive data visuals? DataViz Weekly is back with a fresh selection of projects that use powerful graphics to help unravel various trends and patterns. Here are our top picks from what we’ve most recently come across out there:
- End of the UK’s coal power era and lessons for the world — The Washington Post
- Hurricane Milton’s impact and power outages — Bloomberg
- Waffle House Index for Florida under and after Milton — Riley Walz
- Opioid overdose deaths across the United States — NYT Opinion
- Categories: Data Visualization Weekly
- No Comments »
Stock Chart Creation in JavaScript: Step-by-Step Guide
September 5th, 2023 by Shachee Swadia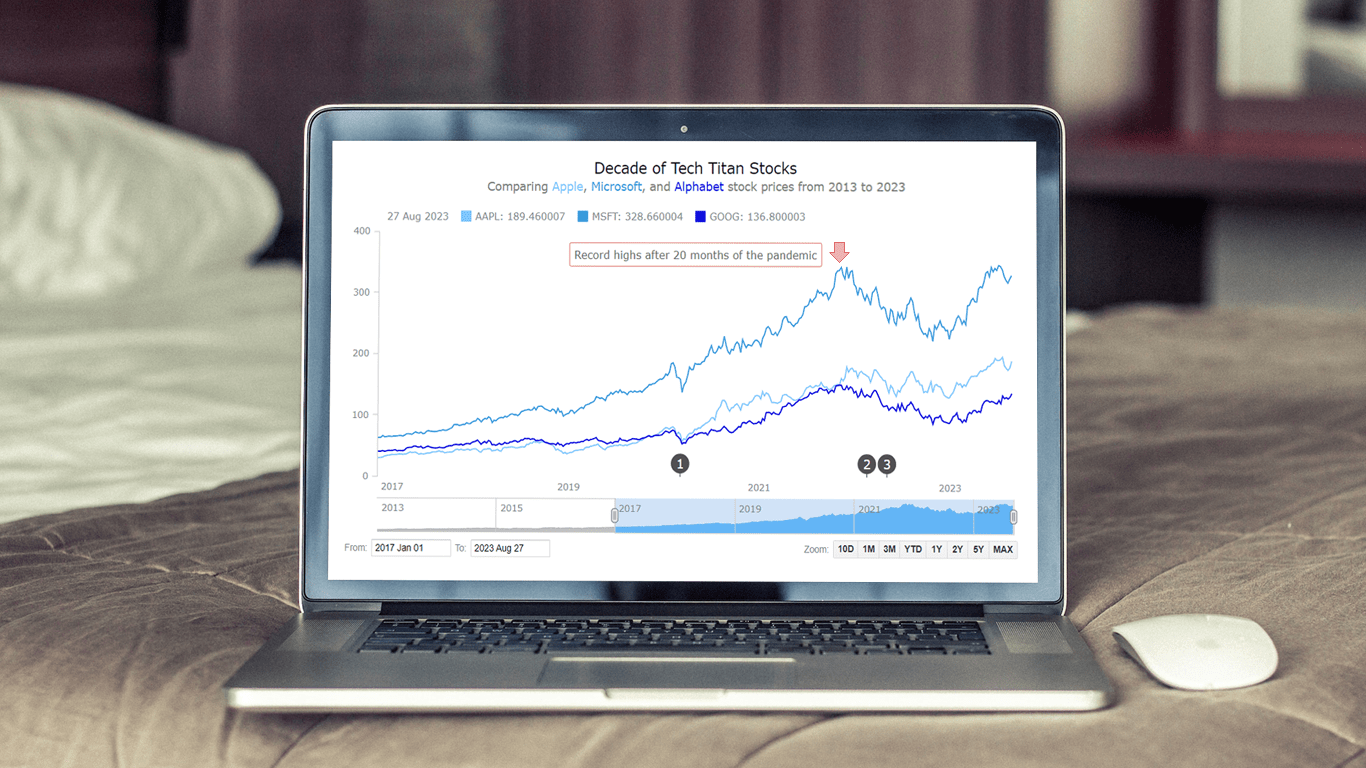 Chances are, you’ve come across various stock charts, whether you’re a seasoned trader or not. If crafting your data graphics piques your interest, you’re in the right place. Welcome to this user-friendly tutorial on building an interactive stock chart using JavaScript!
The JS stock chart we’ll create by the end of this guide will visually compare stock prices for three tech giants — Apple, Microsoft, and Google (Alphabet) — over the past decade. It’s a robust example to illustrate the stock charting process and the power of market data visualization.
So, hop on board as we explore the world of stock charts and learn how to create one from scratch.
Read the JS charting tutorial »
- Categories: AnyChart Charting Component, AnyStock, Big Data, Financial Charts, HTML5, JavaScript, JavaScript Chart Tutorials, Stock Charts, Tips and Tricks
- No Comments »
Building Area Chart with JavaScript
May 12th, 2022 by Awan Shrestha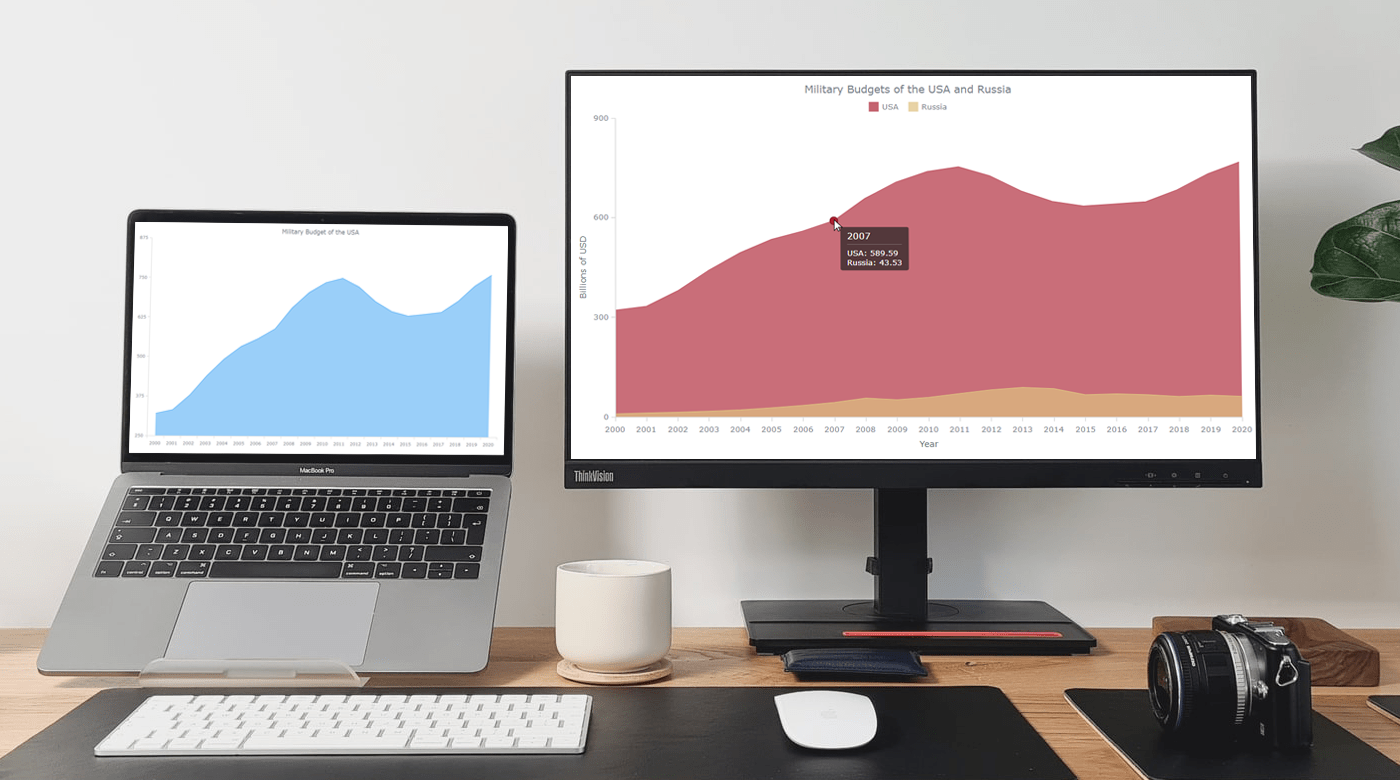 If you are into data visualization, one of the things that you might often need to do is represent a variable’s values over time. Or, you might need to compare multiple datasets in terms of how they are changing during a certain period. This is where area charts can be helpful.
Not sure how to build an elegant area chart? Now you will master a really easy way! In this step-by-step tutorial, we will be visualizing data on the military budgets of the USA and Russia over the past two decades in interactive area charts using JavaScript. All aboard!
Read the JS charting tutorial »
- Categories: AnyChart Charting Component, HTML5, JavaScript, JavaScript Chart Tutorials, Tips and Tricks
- No Comments »
How to Create Financial Open-High-Low-Close (OHLC) Chart Using JavaScript
September 7th, 2021 by Shachee Swadia A stepwise guide on how to create interactive financial charts in the form of an OHLC chart. Visualizing the stock prices of Amazon over the course of Jeff Bezos’s tenure as the CEO.
Financial charts are especially useful to represent large amounts of data and identify trends. Would like to learn one such cool financial chart called the OHLC chart that visualizes stock price movement?
Read the JS charting tutorial »
- Categories: AnyChart Charting Component, AnyStock, Big Data, Financial Charts, HTML5, JavaScript, JavaScript Chart Tutorials, Stock Charts, Tips and Tricks
- No Comments »
How to Create Stacked Area Chart with JavaScript
June 10th, 2020 by Anastasia Zoumpliou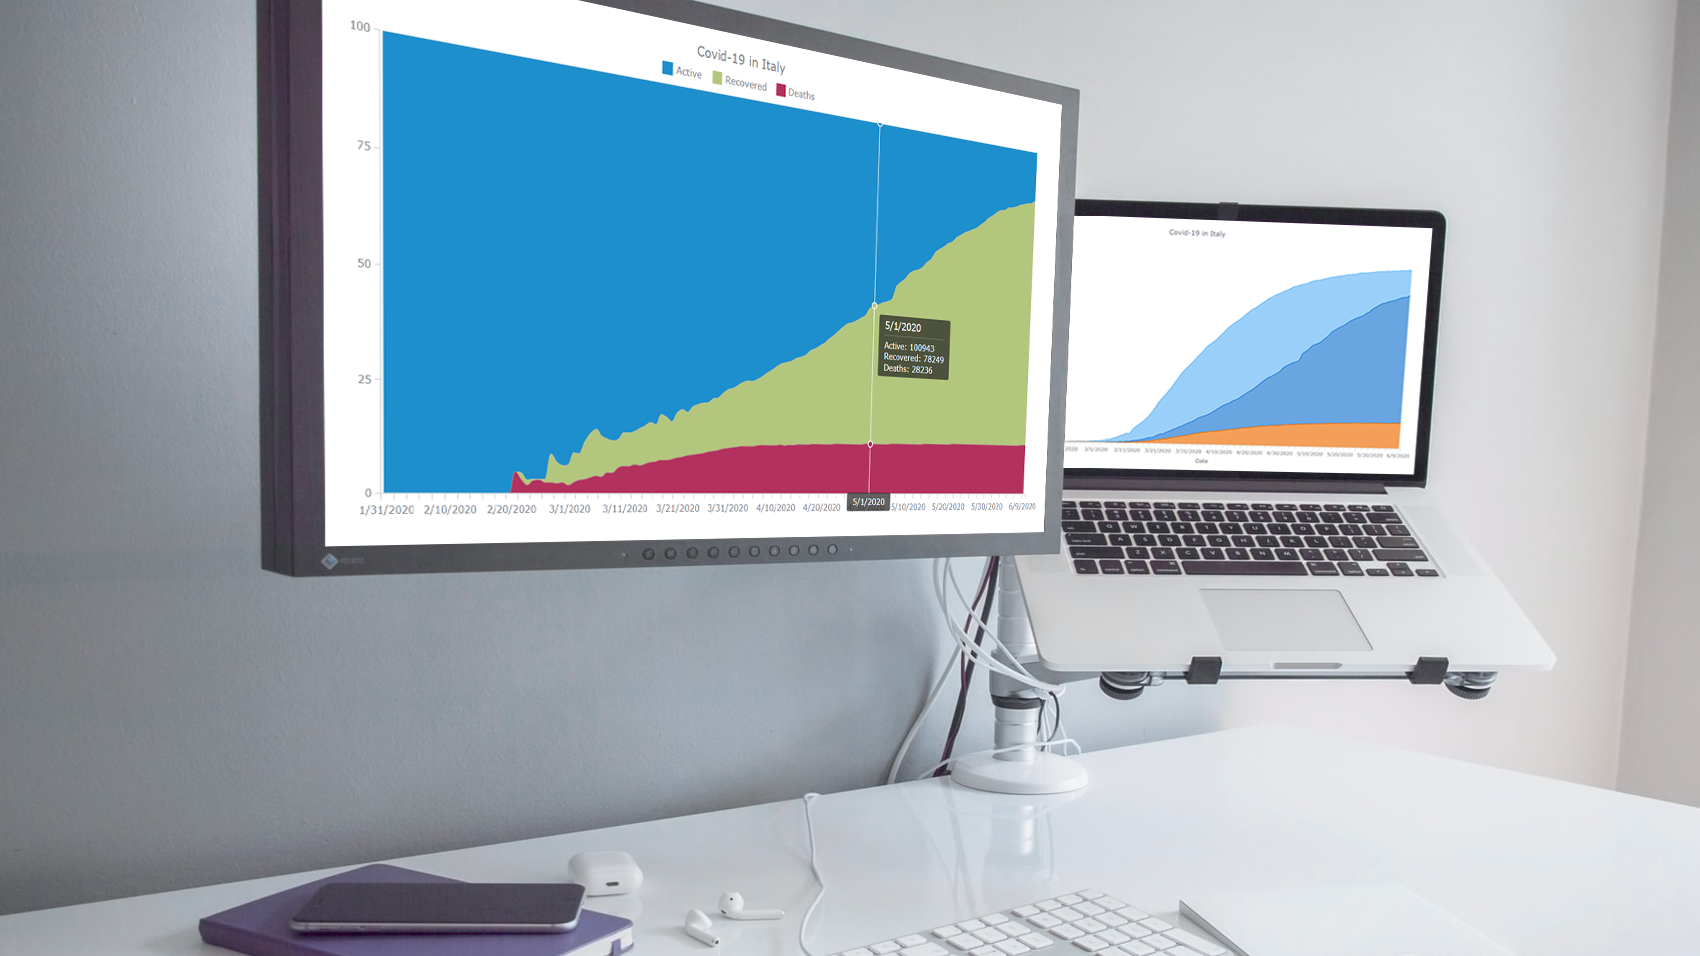 Stacked area charts, a variation of classic area charts, are quite a popular form of data visualization. They work great to graphically represent how multiple variables and their totals are changing over time. In this tutorial, I will show you how to easily create an interactive JavaScript stacked area chart which will look compelling in any HTML5 project, web site or app.
To demonstrate this way, which is quite simple to master even if you only have basic HTML coding skills, I am going to visualize official data about the outbreak of the COVID-19 pandemic in Italy. The visualizations built along the tutorial will display how the numbers of cases, recoveries, and deaths have been changing — from January 31, when the first two cases were confirmed, to yesterday, June 9, when the total number of coronavirus cases in Italy reached 235,561.
Read the JS charting tutorial »
- Categories: AnyChart Charting Component, HTML5, JavaScript, JavaScript Chart Tutorials, Tips and Tricks
- No Comments »
Devon County Council Uses AnyChart JS Charts for Health Data Visualization
August 29th, 2019 by AnyChart Team As a globally leading, award-winning data visualization solution, our JavaScript charting library is used not only in commercial apps but also by governments of all levels worldwide. Devon County Council, a UK local authority administering the English county of Devon, is one such customer.
In particular, Mark Painter from Devon County Council’s Community and Public Health Intelligence Team told us they use AnyChart to generate all the charts in their Health and Wellbeing Profiles. We’ve interviewed him to learn more. (Stack: WordPress/CSV.)
- Categories: AnyChart Charting Component, Success Stories
- No Comments »
How to Create JavaScript Area Chart
October 28th, 2017 by Timothy Loginov Want to know how to build a JavaScript area chart? This article will show you how to do that and tell you who invented area charts in the late 18th century.
The area chart is one of the basic charts used to show changes in data over time. The key feature of this chart type is a colored area between the horizontal X-axis and the line marking the changing value. It can be filled with a color, gradient color, or with a hatch fill.
Look at the chart on the title image. That’s the data visualization being created along the tutorial. Such a JavaScript-based area chart will be interactive and good-looking in any browser, on any website and in any app in HTML5. All samples used in the article are available in our collection on CodePen.
Read the JS charting tutorial »
- Categories: AnyChart Charting Component, HTML5, JavaScript, JavaScript Chart Tutorials, Tips and Tricks
- 3 Comments »
Choose Right Chart Type for Data Visualization. Part 4: Data Distribution
May 4th, 2017 by AnyChart Team Displaying and researching some Data Distribution and relationship between data sets instead of studying precise values in each category is a quite common task in data analysis. It can be solved with the help of the chart types that we are going to identify and explain in this article.
Depending on a situation – the kind of data you have and the specific questions you’d like it to provide answers to – you can pick one approach or another. Just be careful when choosing between one chart type and another for the subsequent data distribution analysis. You want the visualization to clarify data, not obscure it or deliver any sort of confusion. Well, simply make sure you understand the following aspects, mind all the details of your situation, and you will have no problem with visualizing data distribution correctly.
- Categories: Choosing Chart Type, Tips and Tricks
- 1 Comment »