JS Sankey Diagram and Other Improvements in AnyChart 8.4.0 Released Just Now
October 8th, 2018 by AnyChart Team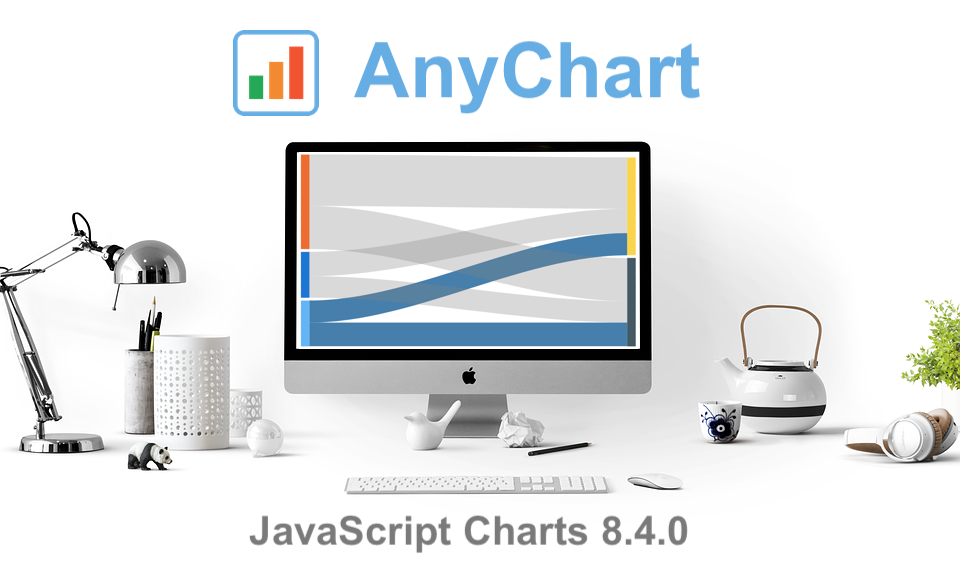 The year’s third major update for AnyChart is out, featuring the JS Sankey Diagram chart type as the ultimate centerpiece of the new release.
Learn more about AnyChart 8.4.0 and start making use of our updated JavaScript (HTML5) libraries for interactive data visualization right away.
- Categories: AnyChart charting component, AnyGantt, AnyMap, AnyStock, HTML5, JavaScript
- 1 Comment »
JS Chart Libraries Get New Great Features in 8.3.0 Release of AnyChart, AnyStock, AnyMap and AnyGantt
July 10th, 2018 by AnyChart Team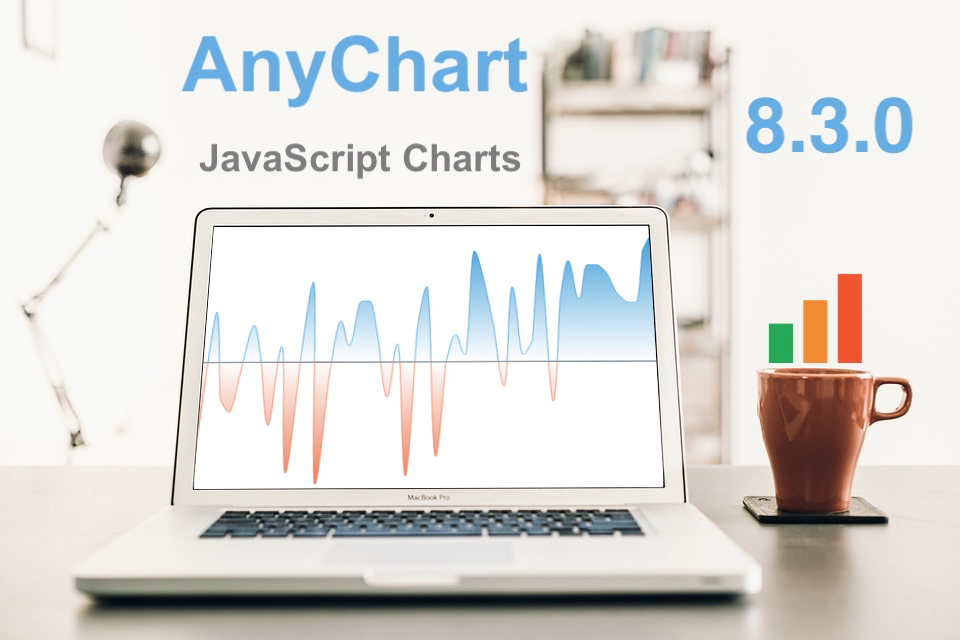 We at AnyChart are proud to announce the 8.3.0 release of our JS chart libraries AnyChart, AnyStock, AnyGantt, and AnyMap! The present major update brings full support of HTML in tooltips, background settings for chart data bounds, coloring rules and thresholds, easy axis label positioning, new technical indicators, and even more.
- Categories: AnyChart charting component, AnyGantt, AnyMap, AnyStock, Financial charts, Gantt Chart, HTML5, JavaScript, News, Stock charts
- 6 Comments »
JavaScript Chart Libraries AnyChart, AnyGantt, AnyStock and AnyMap Receive Major 8.2.0 Update
March 27th, 2018 by AnyChart Team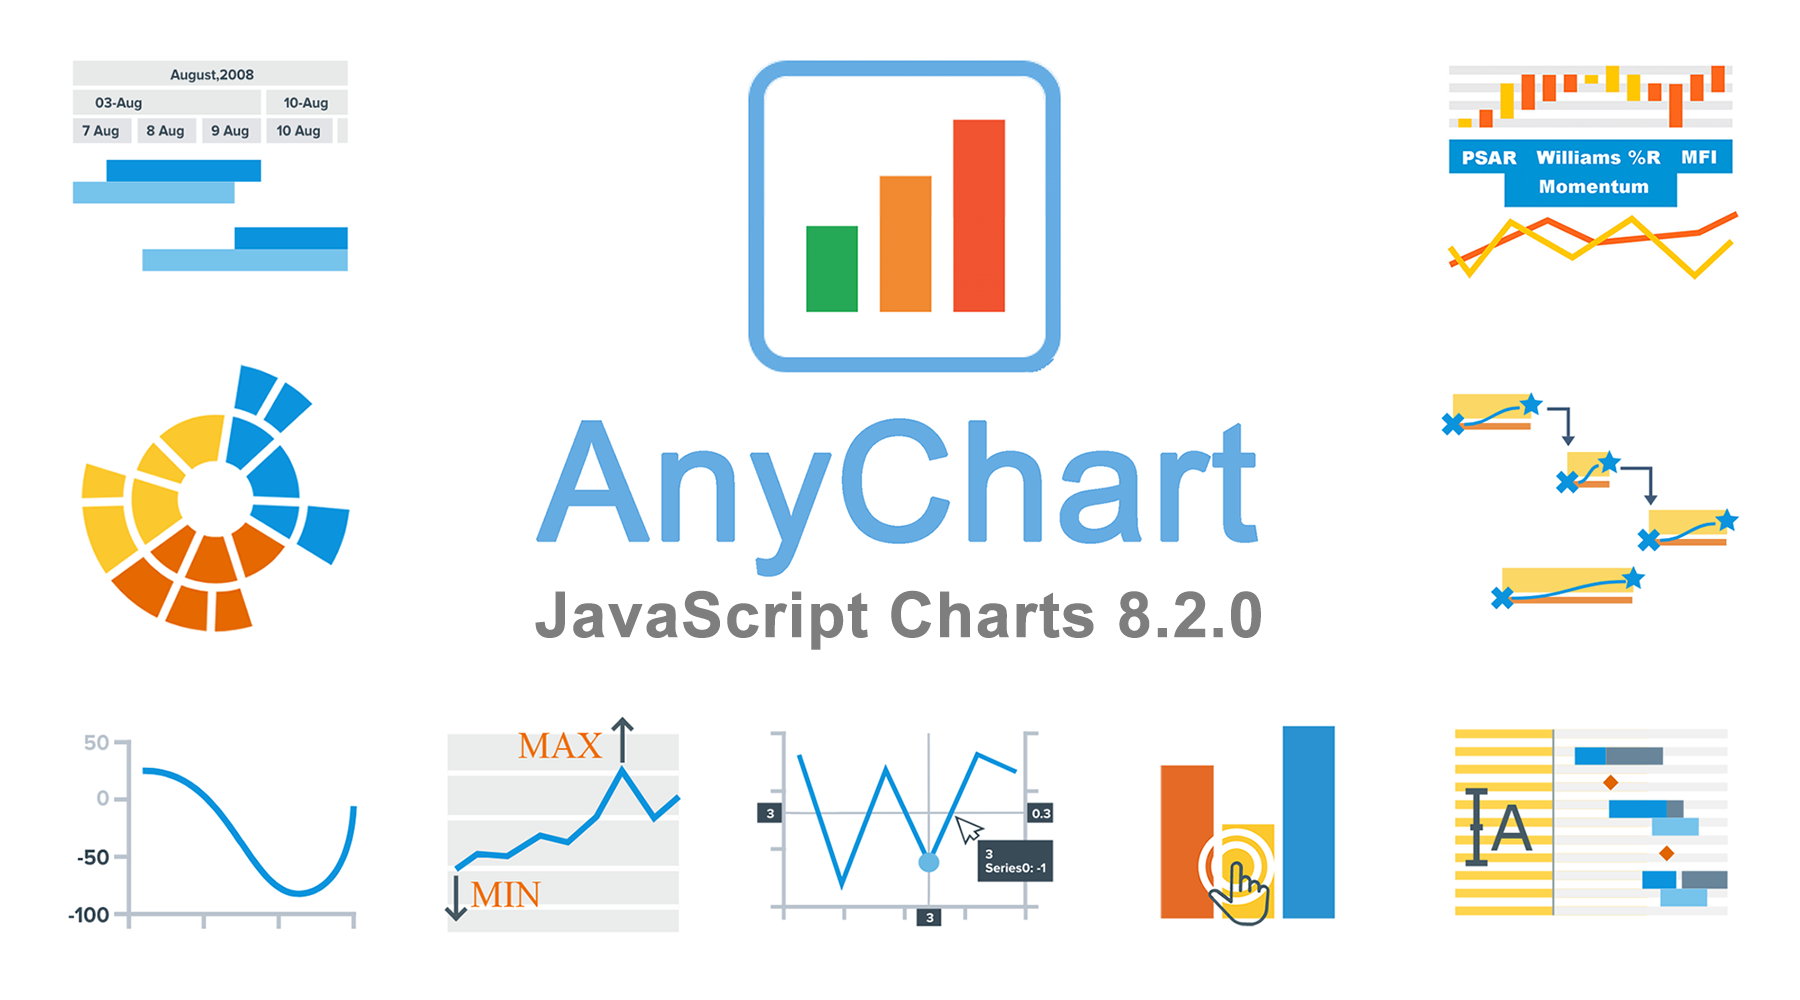 The time has come for another major update of our JavaScript chart libraries, recognized the best in JavaScript technologies earlier this year!
Meet version 8.2.0 of AnyChart, AnyStock, AnyGantt and AnyMap!
To start with, here’s a quick list of what major new cool features have been delivered to our interactive data visualization solutions with this new release:
- Sunburst Chart;
- negative logarithmic scale;
- crosshair multiple labels;
- minimum/maximum labels;
- new technical indicators and additional touch support in stock charts;
- custom drawing, data grid live editor, and new timeline in Gantt charts
Now, let’s take a closer look at each of the major news of AnyChart 8.2.0 and then see what’s next on our roadmap.
- Categories: AnyChart charting component, AnyGantt, AnyMap, AnyStock, Financial charts, Gantt Chart, HTML5, JavaScript, News, Stock charts
- 2 Comments »
Best JavaScript Technology: AnyChart JS Charts Library Wins 2018 DEVIES Award!
February 6th, 2018 by AnyChart Team It’s happened! Our AnyChart JS Charts library has just been officially named the best in JavaScript Technology for innovation and received a prestigious DEVIES award in California! (See all the 2018 DEVIES winners — one for each of the 15 categories.)
2018 DEVIES is reported to be the world’s leading DevTech Awards event, taking place these days during DeveloperWeek in Oakland, CA, the largest developer expo and conference series globally.
- Categories: AnyChart charting component, AnyGantt, AnyMap, AnyStock, HTML5, JavaScript, News, Qlik, Success stories
- 6 Comments »
Happy New Year in JavaScript Charting: AnyChart 8.1.0 Is Out!
December 20th, 2017 by AnyChart Team The New Year and Christmas are already just around the corner, and we have something astonishing for you in this magical time! The next major update for our product family of JavaScript charting libraries is now released, so meet AnyChart 8.1.0!
Check out what new cool and useful features are delivered in the new versions of our HTML5-based interactive data visualization solutions AnyChart, AnyStock, AnyGantt and AnyMap, as well as what we are going to work on next.
- Categories: AnyChart charting component, AnyGantt, AnyMap, AnyStock, Financial charts, Gantt Chart, HTML5, JavaScript, News, Qlik, Stock charts
- 2 Comments »
Modular JavaScript Charting: AnyChart 8 Premiere
October 2nd, 2017 by AnyChart Team Fall is an amazing time for TV, movie, theater, and other art lovers as that’s when a lot of premieres are being launched. Well, we are happy to contribute to the debut mainstream this time! Meet AnyChart 8, a modular JavaScript charting system taking the convenience, performance, and customization in the art of interactive data visualization to the next level.
Join us in reviewing the core innovations delivered in the 8th, module-based generation of AnyChart, including the brand new features now available in our JS charting libraries AnyChart, AnyStock, AnyGantt, and AnyMap, as well as what else is in our nearest plans.
AnyChart JS Charts 8.0.0: Modules, Custom Builds, and Much More
The 8.0.0 release of the AnyChart, AnyGantt, AnyMap, and AnyStock JavaScript (HTML5) charting libraries delivers a lot of brand new features and technical improvements. Please see the list below for a quick overview of what’s new.
- Categories: AnyChart charting component, AnyGantt, AnyMap, AnyStock, Dashboards, Financial charts, Gantt Chart, HTML5, JavaScript, News, Stock charts
- 5 Comments »
Data Visualization with JavaScript: The Story of AnyChart JS Charts
September 7th, 2017 by AnyChart Team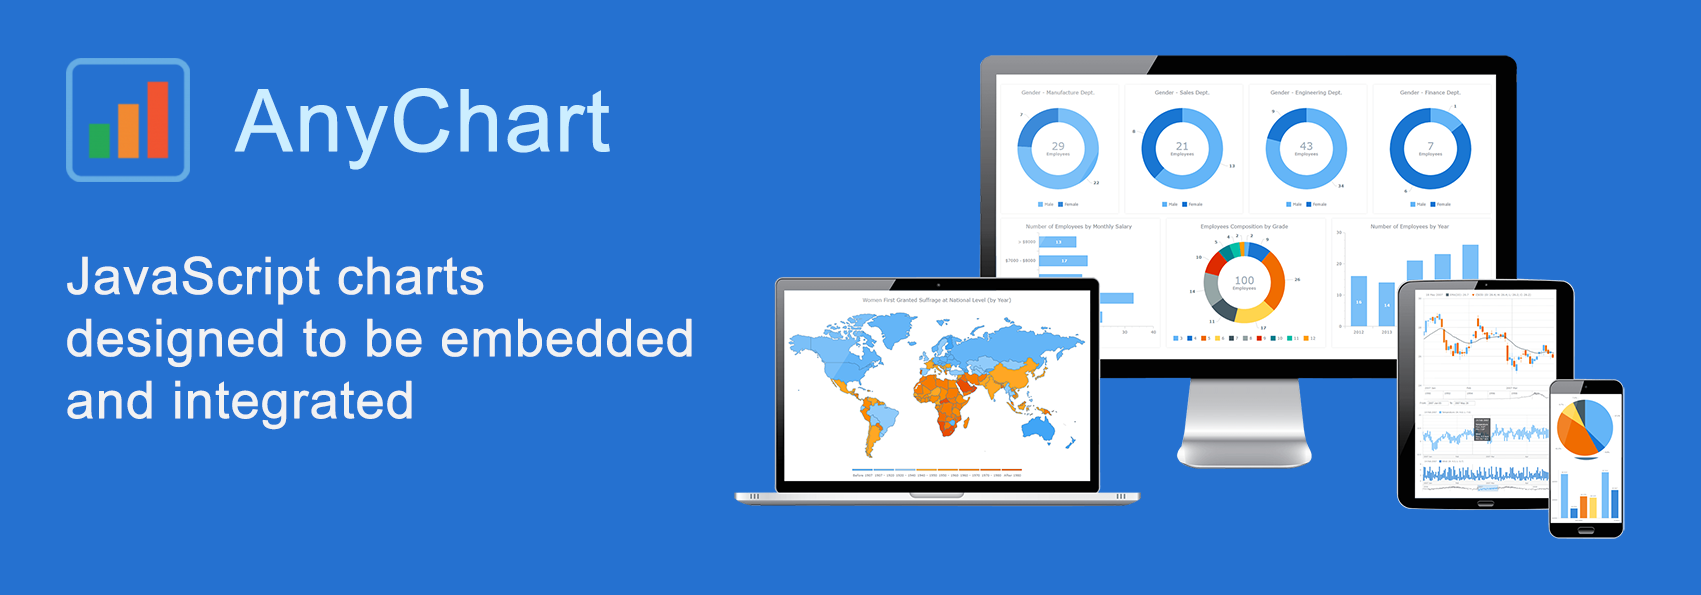 AnyChart is a flexible JavaScript (HTML5) based solution that allows you to create interactive and great looking charts. It is a cross-browser and cross-platform charting solution intended for everybody who deals with creation of dashboard, reporting, analytics, statistical, financial or any other data visualization solutions. AnyChart works everywhere -PCs, Macs, iPhones, iPads, Android devices and helps businesses transform operational data into actionable information.
Kevin William David interviewed Anton Baranchuk, CEO at AnyChart to know more.
- Categories: AnyChart charting component, AnyGantt, AnyMap, AnyStock, Business Intelligence, Flash platform, GraphicsJS, HTML5, JavaScript, Oracle Apex, Qlik, Success stories
- No Comments »
AnyChart JavaScript Charting Libraries 7.14.0 Released: Can’t Stop Perfecting Data Visualization!
May 30th, 2017 by AnyChart Team Here are the spring May flowers we promised. After the hard work put in over the past months, we’re happy to announce that the 7.14.0 release of our JavaScript charting libraries AnyChart, AnyStock, AnyMap, and AnyGantt is out and ready to download! It brings you new cool features and important improvements that will make your data visualization life even better.
Now, we invite you to discover all the new JavaScript/HTML5 charting capabilities that the 7.14.0 version of AnyChart’s data visualization software product family has to offer to you. Here’s a quick overview…
- Categories: AnyChart charting component, AnyGantt, AnyMap, AnyStock, Business Intelligence, Dashboards, Financial charts, Gantt Chart, HTML5, JavaScript, News, Stock charts
- 7 Comments »
JavaScript Charts Library Update 7.13.1 Released for AnyChart, AnyStock, AnyMap, AnyGantt
April 18th, 2017 by AnyChart Team “Sweet April showers do spring May flowers,” once wrote 16th-century English poet Thomas Tusser. Well, our customers already know that AnyChart’s April brings flowers, too! Last year we launched the great 7.10.0 version of the AnyChart JavaScript charts library and, basically, of our whole data visualization product family. Now, in the year of 2017, April brings you another great update.
So, please all greet the 7.13.1 release of AnyChart, AnyMap, AnyStock, and AnyGantt – our cute first spring flowers grown especially for you!
- Categories: AnyChart charting component, AnyGantt, AnyMap, AnyStock, HTML5, JavaScript, News, Qlik
- 2 Comments »
How to Integrate AnyChart JavaScript Charts in SAP Web UI
March 30th, 2017 by Sandor van der Neut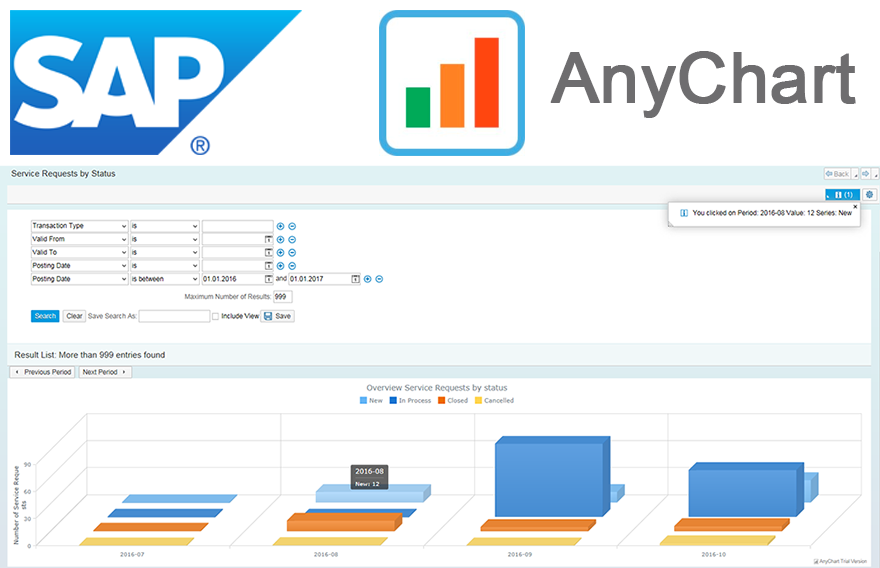 We as ‘mere’ humans are not very good at processing raw statistical data visually when it’s delivered to us in an unrefined form. We are, however, very good in detecting complex patterns when data is presented to us in a graph or a chart. It is therefore no wonder that as a developer you often get the requirement to represent data in a more comprehensible form. When you want to visualize data in the SAP Web UI in a more graphical way the standard possibilities available to you are rather limited. Luckily there are ways to overcome these limitations. When you combine SAP with the graphical power of AnyChart JS Charts a whole range of new possibilities will become available to you.
In this blog I will describe how you can integrate AnyChart in the SAP Web UI with relative ease, how you can feed AnyChart objects with SAP data using both a ‘pull’ and a ‘push’ mechanism and how you can respond in the SAP backend to the events triggered from user interaction with an AnyChart object.
- Categories: AnyChart charting component, AnyGantt, AnyMap, AnyStock, Business Intelligence, Dashboards, HTML5, JavaScript, Tips and tricks
- No Comments »