Creating Timeline Chart of Roman History Using JavaScript
October 3rd, 2024 by AnyChart Team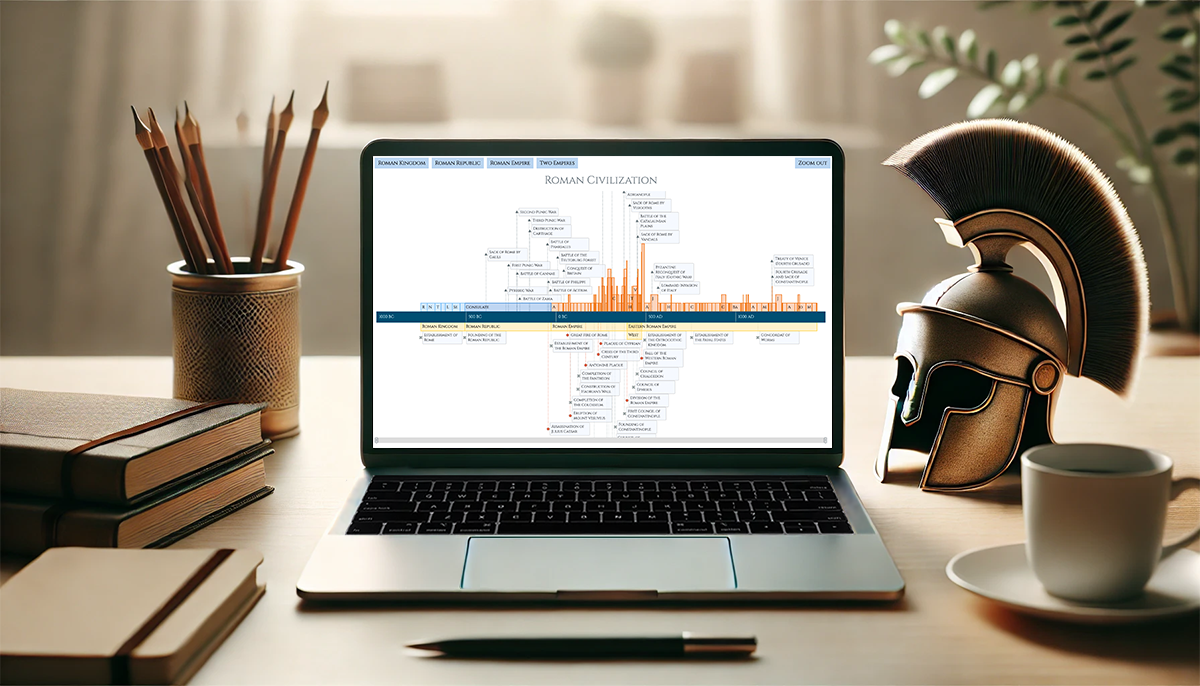 Ever caught yourself thinking about the Roman Empire more often than you’d like to admit? You’re not alone, and we’ve got just the thing for you! With the recent AnyChart JS Charts 8.13.0 release, we’ve enhanced our timeline chart for better support of historical data visualization. We’d love to showcase this improvement in action.
We’ve added a Roman History Timeline to our gallery of timeline chart examples, and we now invite you to discover how it was developed from scratch. In this in-depth JavaScript charting tutorial, we’ll cover everything from A to Z, meticulously guiding you through each step — from setting up the HTML environment to adding detailed data and customizing the visualization to make the chart both informative and engaging. The final result is an interactive timeline that you can proudly call your own Roman Empire.
So, whether you’re a history enthusiast caught up in the recent meme trend or a developer eager to expand your data visualization skills, follow along and learn how to create compelling historical timeline charts using JavaScript!
Read the JS charting tutorial »
- Categories: AnyChart Charting Component, Big Data, HTML5, JavaScript, JavaScript Chart Tutorials, Tips and Tricks
- No Comments »
Introducing AnyChart 8.13.0 for Elevated JavaScript Charting Experience
October 3rd, 2024 by AnyChart Team AnyChart 8.13.0 is now available, bringing a set of new features and improvements designed to further elevate your data visualization experience. In this release, we’ve focused on enhancing the Timeline, Waterfall, and Circle Packing charts in our JavaScript charting library, making them even more flexible and user-friendly. Read on to explore what’s new!
- Categories: AnyChart Charting Component, AnyGantt, AnyMap, AnyStock, Big Data, Business Intelligence, Dashboards, Financial Charts, Gantt Chart, HTML5, JavaScript, News, Stock Charts
- No Comments »
How to Make Sunburst Chart in JavaScript
June 19th, 2023 by Awan Shrestha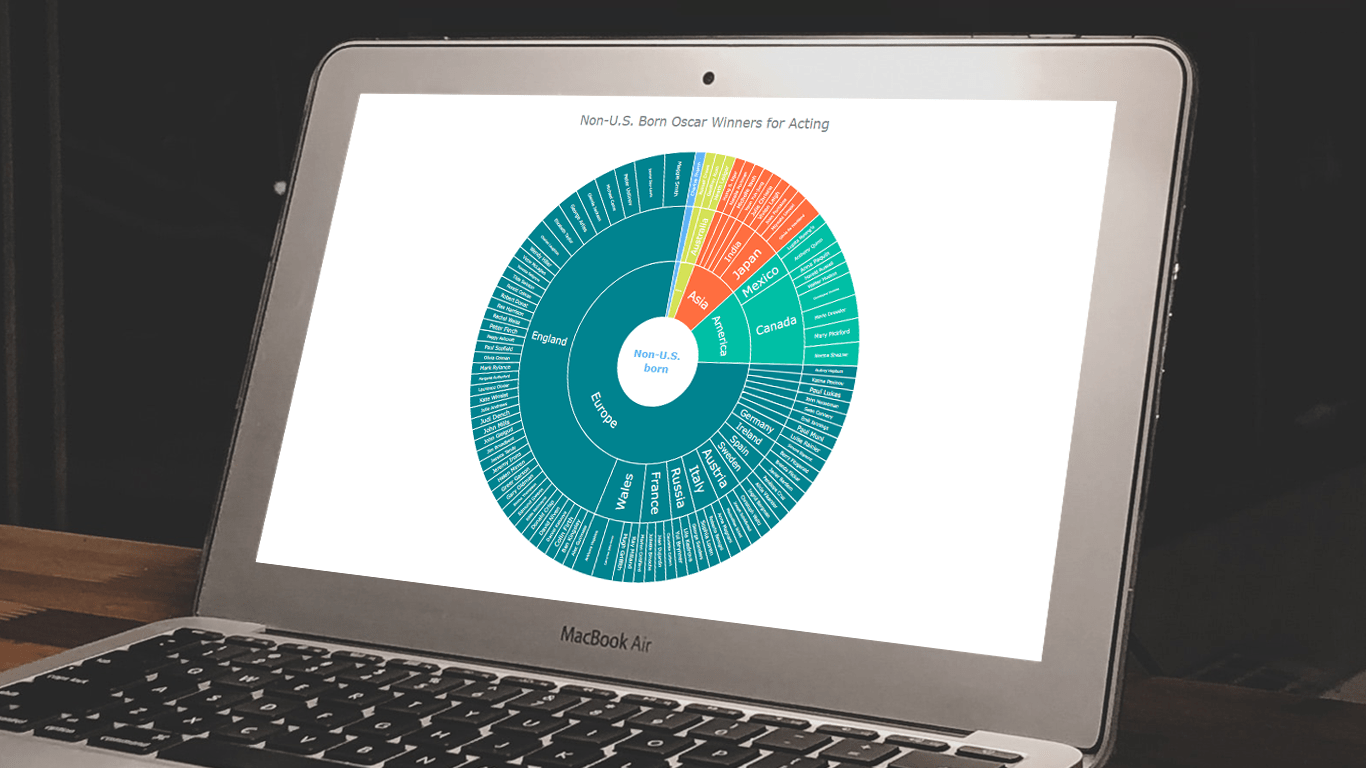 In the world of data all around us, charts play a crucial role in helping us explore and understand data more effectively. One powerful visualization technique is the sunburst chart, which allows us to represent hierarchical datasets, providing insights into complex compositions visually. In this tutorial, I’ll show you how to create your own stunning interactive sunburst charts using JavaScript effortlessly.
We’ll embark on an exciting journey using data about Oscar-winning actors and actresses from countries around the world as an example. Our JS-based sunburst chart will shine a spotlight on the achievements of those born outside the United States, representing the rich diversity of their origins.
Get ready to unlock the secrets of JavaScript sunburst chart development as I’ll guide you step-by-step. Together, we’ll learn how to effortlessly bring data to life, creating this mesmerizing visualization that engages and informs. Let’s dive in and discover the fascinating world of the sunburst chart!
Read the JS charting tutorial »
- Categories: AnyChart Charting Component, Big Data, HTML5, JavaScript, JavaScript Chart Tutorials, Tips and Tricks
- No Comments »
How to Create Donut Chart Using JavaScript
June 13th, 2023 by Shachee Swadia Visualizing data isn’t just insightful, it’s also a lot of fun! One of the simplest and most enjoyable charts you can create is the donut chart. And now, I will show you how to make an awesome interactive one using JavaScript effortlessly!
Aptly named because it looks like a donut, a donut chart is essentially a pie chart with a hole in the center. It can be nice for representing categorical data with a moderate number of categories, where each slice represents a percentage of the whole. Throughout this tutorial, we will apply the donut charting technique to visualize the impressive Grand Slam title tally of a tennis legend, Roger Federer. So you’ll have a real-world example to work with and enhance your understanding.
I’ll guide you through each step, ensuring a seamless learning experience. By the end of the tutorial, you’ll have all the skills and knowledge required to create your very own personalized and impressive JS donut chart. So let’s embark on this exciting journey and get started!
Read the JS charting tutorial »
- Categories: AnyChart Charting Component, HTML5, JavaScript, JavaScript Chart Tutorials, Tips and Tricks
- No Comments »
Vasari Diagram Visualizes Wikipedia Networks of Painters with AnyChart JS
September 29th, 2022 by AnyChart Team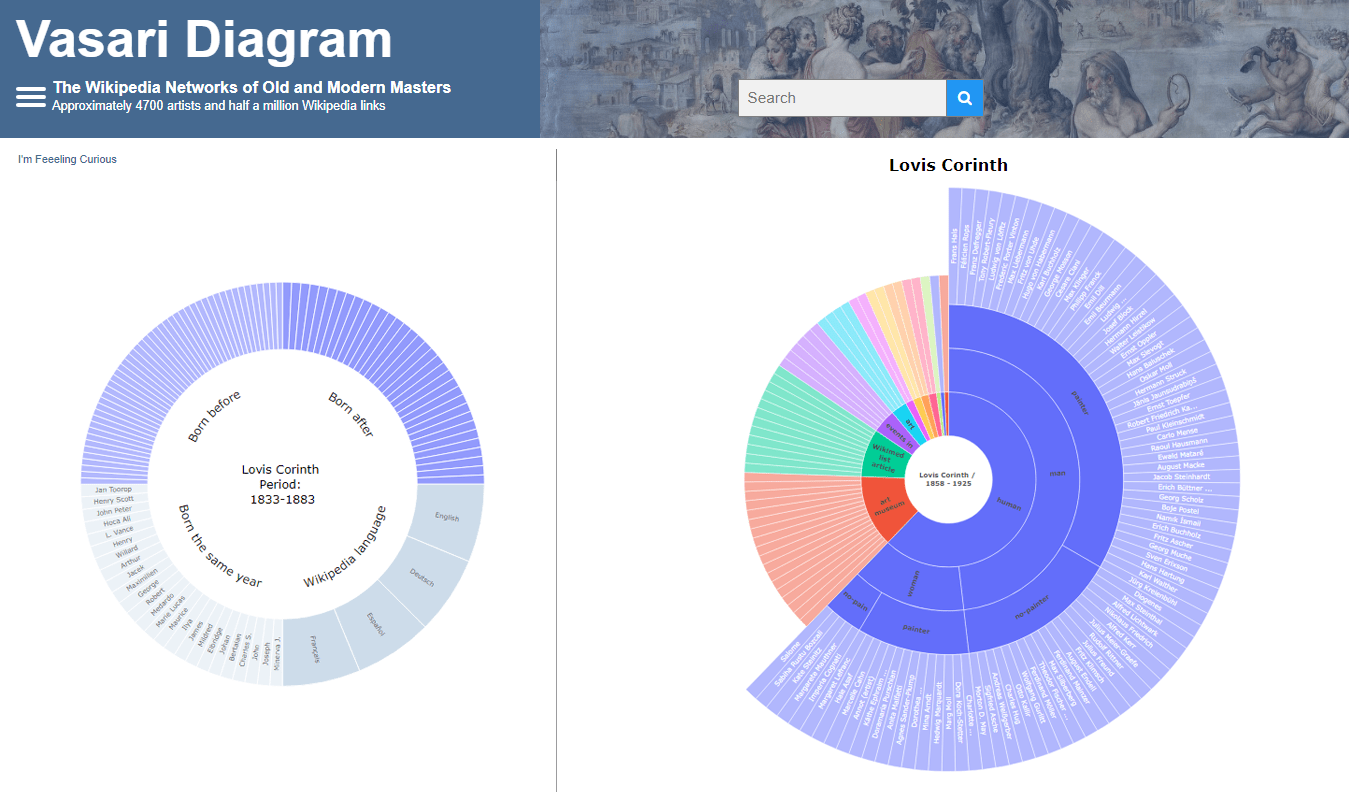 There are numerous cases where our customers first picked a different JavaScript charting library to operate data visualization in their projects but then could not get absolutely what they wanted, and in the end, switched to AnyChart and are happy with their new and final choice. Here is one of such examples.
Francis Lapique and Temenuzhka Dimova ended up using our Sunburst Chart solution in their Vasari Diagram, a fascinating asset for art history researchers and enthusiasts. This project lets anyone explore which people and topics various painters are connected with.
Read our interview where Francis describes the Vasari Diagram project and how AnyChart is used, and check it out!
- Categories: AnyChart Charting Component, Big Data, Charts and Art, HTML5, JavaScript, Success Stories
- No Comments »
COVID-19 Vaccine, Future, Impact, and Non-COVID Wiki Atlas Visualizations — DataViz Weekly
May 8th, 2020 by AnyChart Team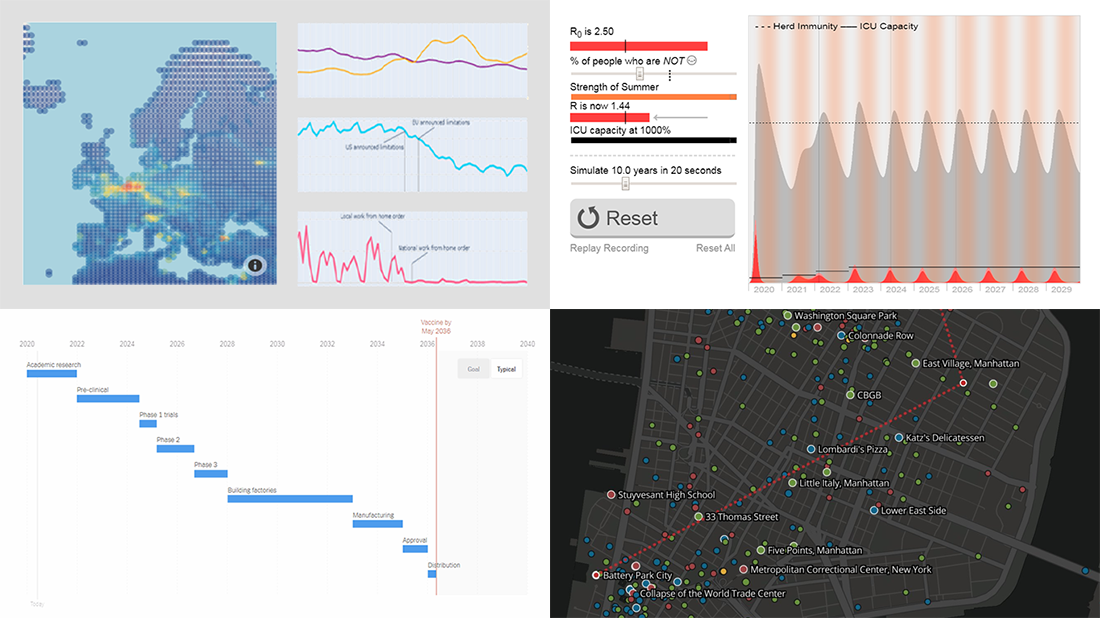 Without any exaggeration, the vast majority of data visualizations made public these weeks (and already months) are about the novel coronavirus pandemic. In compliance with the general trend, three of the four projects presented in the new DataViz Weekly article shed light on issues related to COVID-19. Take a glance at a quick list of the featured data visualization works and read more to meet them.
- COVID-19 vaccine development timeframe and how to reduce it – NYT
- COVID-19 future, in playable simulators – M. Salathé & N. Case
- COVID-19 impact on traffic and air pollution in Europe – European Data Portal
- Atlas of places featured in Wikipedia – T. Noulas, R. Schifanella, D. Sáez-Trumper & J. Tan
- Categories: Data Visualization Weekly
- No Comments »
Visual Analytics Examples for City Climate, Pain Pills, Water Fountains, and Space Travels — DataViz Weekly
July 19th, 2019 by AnyChart Team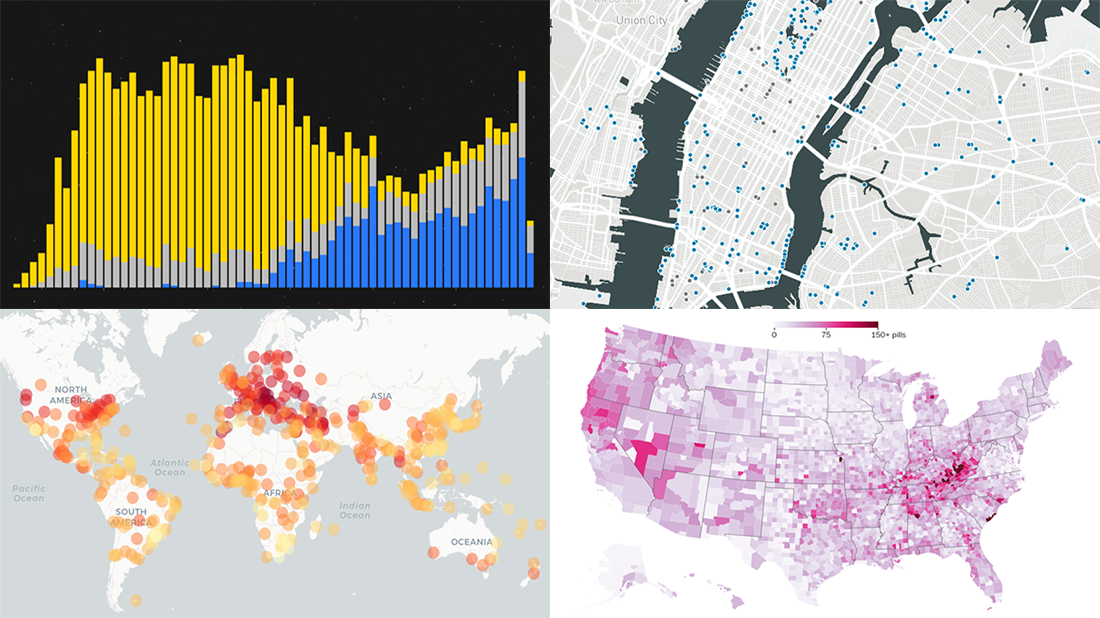 Enjoy another selection of new cool data visualization projects as great examples of visual analytics in action. Here’s what questions the charts featured today on DataViz Weekly show answers to:
- What city’s current climate will your city’s climate resemble in 2050? — Crowther Lab
- How legal pain pills were distributed across the United States in 2006-2012? — The Washington Post
- Where is the nearest water fountain? — Matthew Moy de Vitry
- How space travel has developed since Sputnik in 1957? — Reuters
- Categories: Data Visualization Weekly
- No Comments »