 In the world of data all around us, charts play a crucial role in helping us explore and understand data more effectively. One powerful visualization technique is the sunburst chart, which allows us to represent hierarchical datasets, providing insights into complex compositions visually. In this tutorial, I’ll show you how to create your own stunning interactive sunburst charts using JavaScript effortlessly.
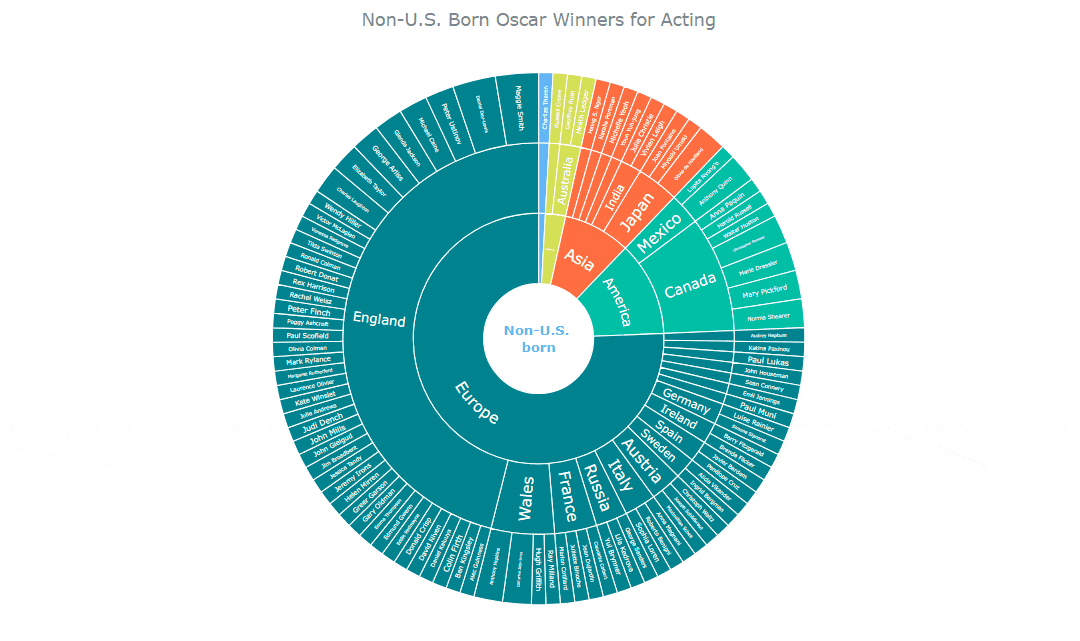
We’ll embark on an exciting journey using data about Oscar-winning actors and actresses from countries around the world as an example. Our JS-based sunburst chart will shine a spotlight on the achievements of those born outside the United States, representing the rich diversity of their origins.
Get ready to unlock the secrets of JavaScript sunburst chart development as I’ll guide you step-by-step. Together, we’ll learn how to effortlessly bring data to life, creating this mesmerizing visualization that engages and informs. Let’s dive in and discover the fascinating world of the sunburst chart!
What Is Sunburst Chart?
The sunburst chart, also known as a radial treemap or multi-level pie chart, is a powerful visualization tool used to represent hierarchical datasets. It showcases data in a circular layout, with nested rings that depict different levels of the hierarchy. The innermost ring represents the top level, while the outer rings correspond to subcategories.
Each ring is divided into slices, each showing a specific data point within its respective category. The size of the slices can sometimes indicate the values associated with the data points. Users can drill down to explore more detailed information and gain deeper insights by clicking on a particular level of the hierarchy.
The sunburst chart offers an intuitive and visually appealing way to analyze hierarchical data, enabling users to easily grasp the relationships and proportions between different categories and subcategories. Its interactive nature facilitates exploration and discovery, making it a valuable tool for visual data analytics.
Sunburst Chart Preview
Behold the grand finale of this tutorial, the magnificent interactive JavaScript-based sunburst chart we’ll create together in a step-by-step fashion.
Let’s waste no more time and dive right into the charting process!
Creating Basic JS Sunburst Chart
The concept of the interactive sunburst chart may initially seem daunting and time-consuming when it comes to this data visualization development, but fear not! Let’s break it down into four simple steps. I’ll guide you through each, and you’ll soon realize it’s a breeze.
- Create a web page in HTML
- Include the required JavaScript files
- Add the data
- Write some JavaScript code
1. Create a web page in HTML
Let’s kick off our sunburst chart adventure by creating a simple HTML page as its foundation. We’ll start by setting the page title to “JavaScript Sunburst Chart.”
To contain the chart, we’ll add an HTML block element as a <div>. Let’s give this div an id attribute of “container” so that we can easily reference it later in our journey.
Then let’s add a touch of style to our chart. Inside the <style> block, we’ll include a few CSS rules that will display our sunburst chart beautifully across the entire screen. We’ll set the width and height properties to 100% to ensure it fills the entire available space. Additionally, we’ll set the margin and padding to 0, allowing our chart to stand out without any unnecessary boundaries. Remember, these initial rules are just a starting point, and you’re welcome to customize them as you see fit!
<!DOCTYPE html>
<html lang="en">
  <head>
    <meta charset="utf-8">
    <title>JavaScript Sunburst Chart</title>
    <style type="text/css">
      html, body, #container {
        width: 100%;
        height: 100%;
        margin: 0;
        padding: 0;
      }
    </style>
  </head>
  <body>
    <div id="container"></div>
  </body>
</html>
With our basic HTML page set up and our chart container ready to embrace the visual magic, it’s time to move forward and unlock the secrets of creating a captivating sunburst chart with JavaScript. Let’s continue our journey and bring our data to life in the most stunning way possible!
2. Include the required JavaScript files
Now, it’s time to bring the power of JavaScript to our HTML page by including the necessary script files. In the <head> section of our HTML page, we’ll ensure that these files find their rightful place. We have a couple of options to achieve this. One option is to download the required script files and include them locally in our project. In this tutorial, let’s take a different approach for efficiency and include the scripts directly from a CDN (“content delivery network”).
There are not many JavaScript charting libraries out there that support sunburst charts out of the box. One of those is AnyChart, which has thorough documentation for its vast data visualization capabilities and a gallery full of ready-to-use chart examples, so I’ve chosen it for the sunburst chart development showcase in this tutorial.
AnyChart boasts a modular structure that allows us to seamlessly connect only the specific chart types and features as needed, optimizing the size of the running JavaScript code and ensuring smooth performance. For our sunburst chart to dazzle, we need to add two essential modules: the Core module, which forms the backbone of the library, and the Sunburst module, which specifically empowers us to create captivating sunburst visualizations.
<!DOCTYPE html>
<html lang="en">
  <head>
    <meta charset="utf-8">
    <title>JavaScript Sunburst Chart</title>
    <script src="https://cdn.anychart.com/releases/8.11.1/js/anychart-core.min.js"></script>
    <script src="https://cdn.anychart.com/releases/8.11.1/js/anychart-sunburst.min.js"></script>
    <style type="text/css">
      html, body, #container {
        width: 100%;
        height: 100%;
        margin: 0;
        padding: 0;
      }
    </style>
  </head>
  <body>
    <div id="container"></div>
    <script>
      // All the code for the JS sunburst chart will come here
    </script>
  </body>
</html>
With the JavaScript files in place, our HTML page is now armed with the necessary tools to embark on this charting journey. Let’s forge ahead and unlock the secrets of crafting a magnificent sunburst chart!
3. Add the data
Fantastic! Let’s dive deeper into the world of Oscar-winning actors and actresses and explore their diverse origins. Our focus will be on visualizing data specifically related to non-Americans who have received the prestigious prize in the four primary acting categories since the inception of the Academy Awards:
- Best Actor
- Best Actress
- Best Supporting Actor
- Best Supporting Actress
I have obtained a dataset from Wanderu and updated it using the latest data from the official Academy Awards Database and Wikipedia. To make it suitable for our JavaScript sunburst chart, I’ve structured the data into an array of objects, where each object contains essential details such as name, value, and children.
To start we will begin with data from one country for the sake of simplicity and clarity.
var data = [
  {
    name: "World", value: 115, children: [
      {
        name: "Europe", value: 87, children: [
          {
            name: "England", value: 53, children: [
              { name: "Alec Guinness", value: 1 },
              { name: "Ben Kingsley", value: 1 },
              { name: "Charles Laughton", value: 2 },
              { name: "Colin Firth", value: 1 },
              { name: "Daniel Day-Lewis", value: 3 },
              { name: "Daniel Kaluuya", value: 1 },
              { name: "David Niven", value: 1 },
              { name: "Donald Crisp", value: 1 },
              { name: "Eddie Redmayne", value: 1 },
              { name: "Edmund Gwenn", value: 1 },
              { name: "Elizabeth Taylor", value: 2 },
              { name: "Emma Thompson", value: 1 },
              { name: "Gary Oldman", value: 1 },
              { name: "George Arliss", value: 2 },
              { name: "Glenda Jackson", value: 2 },
              { name: "Greer Garson", value: 1 },
              { name: "Helen Mirren", value: 1 },
              { name: "Jeremy Irons", value: 1 },
              { name: "Jessica Tandy", value: 1 },
              { name: "Jim Broadbent", value: 1 },
              { name: "John Gielgud", value: 1 },
              { name: "John Mills", value: 1 },
              { name: "Judi Dench", value: 1 },
              { name: "Julie Andrews", value: 1 },
              { name: "Kate Winslet", value: 1 },
              { name: "Laurence Olivier", value: 1 },
              { name: "Maggie Smith", value: 3 },
              { name: "Margaret Rutherford", value: 1 },
              { name: "Mark Rylance", value: 1 },
              { name: "Michael Caine", value: 2 },
              { name: "Olivia Colman", value: 1 },
              { name: "Paul Scofield", value: 1 },
              { name: "Peggy Ashcroft", value: 1 },
              { name: "Peter Finch", value: 1 },
              { name: "Peter Ustinov", value: 2 },
              { name: "Rachel Weisz", value: 1 },
              { name: "Rex Harrison", value: 1 },
              { name: "Robert Donat", value: 1 },
              { name: "Ronald Colman", value: 1 },
              { name: "Tilda Swinton", value: 1 },
              { name: "Vanessa Redgrave", value: 1 },
              { name: "Victor McLaglen", value: 1 },
              { name: "Wendy Hiller", value: 1 }
            ]
          }
        ]
      }
    ]
  }
];
As we progress, we’ll gradually expand our visualization to include data from all countries. So, rest assured, we’ll soon have a comprehensive view of the incredible achievements of Oscar-winning actors and actresses from around the world.
Now, let’s harness the power of JavaScript to breathe life into our data visualization masterpiece!
4. Write some JS code
To kick off our journey into the world of JavaScript-based sunburst charts, we’ll make sure our code struts its stuff once the stage is set by using the snazzy anychart.onDocumentReady() function.
<script>
  anychart.onDocumentReady(function () {
    // The JS Sunburst Chart's code will be written here.
  }
</script>
Now, let’s bring in the data and set the stage by decking it out as a tree.
var chart = anychart.sunburst(data, "as-tree");We should also add a chart title to make it instantly clear exactly what the upcoming diagram will show. To house our masterpiece, we’ll assign it a special container, the very one we designated in our opening act.
chart.title("Non-U.S. Born Oscar Winners for Acting");
chart.container("container");
The complete stage is set, the lights are dimmed, and it’s time for our graphic to take center stage! Let’s draw our sunburst chart, transforming data into a mesmerizing visual performance.
chart.draw();Check out the output and prepare to be amazed as you explore the interactive drill-down feature of our JavaScript (HTML5) sunburst chart! Click here, click there, and witness the dynamic transformation right before your eyes. You can see it right below or visit the AnyChart Playground, where the full code editor awaits your creative touch.
But hold on, there’s more! In the next section, we’ll unleash our creative powers and dive into customization tips and tricks that will elevate your chart to the next level.
<!DOCTYPE html>
<html lang="en">
  <head>
    <meta charset="utf-8">
    <title>JavaScript Sunburst Chart</title>
    <script src="https://cdn.anychart.com/releases/8.11.1/js/anychart-core.min.js"></script>
    <script src="https://cdn.anychart.com/releases/8.11.1/js/anychart-sunburst.min.js"></script>
    <style type="text/css">
      html, body, #container {
        width: 100%;
        height: 100%;
        margin: 0;
        padding: 0;
      }
    </style>
  </head>
  <body>
    <div id="container"></div>
    <script>
      anychart.onDocumentReady(function(){
        // create the data
        var data = [
          {
            name: "World", value: 115, children: [
              {
                name: "Europe", value: 87, children: [
                  {
                    name: "England", value: 53, children: [
                      { name: "Alec Guinness", value: 1 },
                      { name: "Ben Kingsley", value: 1 },
                      { name: "Charles Laughton", value: 2 },
                      { name: "Colin Firth", value: 1 },
                      { name: "Daniel Day-Lewis", value: 3 },
                      { name: "Daniel Kaluuya", value: 1 },
                      { name: "David Niven", value: 1 },
                      { name: "Donald Crisp", value: 1 },
                      { name: "Eddie Redmayne", value: 1 },
                      { name: "Edmund Gwenn", value: 1 },
                      { name: "Elizabeth Taylor", value: 2 },
                      { name: "Emma Thompson", value: 1 },
                      { name: "Gary Oldman", value: 1 },
                      { name: "George Arliss", value: 2 },
                      { name: "Glenda Jackson", value: 2 },
                      { name: "Greer Garson", value: 1 },
                      { name: "Helen Mirren", value: 1 },
                      { name: "Jeremy Irons", value: 1 },
                      { name: "Jessica Tandy", value: 1 },
                      { name: "Jim Broadbent", value: 1 },
                      { name: "John Gielgud", value: 1 },
                      { name: "John Mills", value: 1 },
                      { name: "Judi Dench", value: 1 },
                      { name: "Julie Andrews", value: 1 },
                      { name: "Kate Winslet", value: 1 },
                      { name: "Laurence Olivier", value: 1 },
                      { name: "Maggie Smith", value: 3 },
                      { name: "Margaret Rutherford", value: 1 },
                      { name: "Mark Rylance", value: 1 },
                      { name: "Michael Caine", value: 2 },
                      { name: "Olivia Colman", value: 1 },
                      { name: "Paul Scofield", value: 1 },
                      { name: "Peggy Ashcroft", value: 1 },
                      { name: "Peter Finch", value: 1 },
                      { name: "Peter Ustinov", value: 2 },
                      { name: "Rachel Weisz", value: 1 },
                      { name: "Rex Harrison", value: 1 },
                      { name: "Robert Donat", value: 1 },
                      { name: "Ronald Colman", value: 1 },
                      { name: "Tilda Swinton", value: 1 },
                      { name: "Vanessa Redgrave", value: 1 },
                      { name: "Victor McLaglen", value: 1 },
                      { name: "Wendy Hiller", value: 1 }
                    ]
                  },
                  {
                    name: "Austria", value: 3, children: [
                      { name: "Christoph Waltz", value: 1 },
                      { name: "Joseph Schildkraut", value: 1 },
                      { name: "Maximillian Schell", value: 1 }
                    ]
                  },
                  {
                    name: "Wales", value: 6, children: [
                      { name: "Ray Milland", value: 1 },
                      { name: "Hugh Griffith", value: 1 },
                      { name: "Catherine Zeta-Jones", value: 2 },
                      { name: "Anthony Hopkins", value: 2 }
                    ]
                  },
                  {
                    name: "France", value: 4, children: [
                      { name: "Claudette Colbert", value: 1 },
                      { name: "Jean Dujardin", value: 1 },
                      { name: "Juliette Binoche", value: 1 },
                      { name: "Marion Cotillard", value: 1 }
                    ]
                  },
                  {
                    name: "Italy", value: 3, children: [
                      { name: "Anna Magnani", value: 1 },
                      { name: "Roberto Benigni", value: 1 },
                      { name: "Sophia Loren", value: 1 }
                    ]
                  },
                  {
                    name: "Russia", value: 3, children: [
                      { name: "George Sanders", value: 1 },
                      { name: "Lila Kedrova", value: 1 },
                      { name: "Yul Brynner", value: 1 }
                    ]
                  },
                  {
                    name: "Germany", value: 2, children: [
                      { name: "Luise Rainier", value: 1 },
                      { name: "Simone Signoret", value: 1 }
                    ]
                  },
                  {
                    name: "Ireland", value: 2, children: [
                      { name: "Barry Fitzgerald", value: 1 },
                      { name: "Brenda Flicker", value: 1 }
                    ]
                  },
                  {
                    name: "Spain", value: 2, children: [
                      { name: "Javier Bardem", value: 1 },
                      { name: "Penélope Cruz", value: 1 }
                    ]
                  },
                  {
                    name: "Sweden", value: 2, children: [
                      { name: "Alicia Vikander", value: 1 },
                      { name: "Ingrid Bergman", value: 1 }
                    ]
                  },
                  {
                    name: "Belgium", value: 1, children: [
                      { name: "Audrey Hepburn", value: 1 }
                    ]
                  },
                  {
                    name: "Greece", value: 1, children: [
                      { name: "Katina Paxinou", value: 1 }
                    ]
                  },
                  {
                    name: "Hungary", value: 1, children: [
                      { name: "Paul Lukas", value: 1 }
                    ]
                  },
            {
                    name: "Romania", value: 1, children: [
                      { name: "John Houseman", value: 1 }
                    ]
                  },
                  {
                    name: "Scotland", value: 1, children: [
                      { name: "Sean Connery", value: 1 }
                    ]
                  },
                  {
                    name: "Switzerland", value: 1, children: [
                      { name: "Emil Jannings", value: 1 }
                    ]
                  },
                  {
                    name: "Ukraine", value: 1, children: [
                      { name: "Paul Muni", value: 1 }
                    ]
                  }
                ]
              },
              {
                name: "America", value: 14, children: [
                  {
                    name: "Canada", value: 11, children: [
                      { name: "Anna Paquin", value: 1 },
                      { name: "Christopher Plumme", value: 2 },
                      { name: "Harold Russell", value: 1 },
                      { name: "Marie Dressler", value: 2 },
                      { name: "Mary Pickford", value: 2 },
                      { name: "Norma Shearer", value: 2 },
                      { name: "Walter Huston", value: 1 }
                    ]
                  },
                  {
                    name: "Mexico", value: 3, children: [
                      { name: "Anthony Quinn", value: 2 },
                      { name: "Lupita Nyong’o", value: 1 }
                    ]
                  }
                ]
              },
              {
                name: "Asia", value: 10, children: [
                  {
                    name: "Japan", value: 4, children: [
                      { name: "Joan Fontaine", value: 1 },
                      { name: "Miyoshi Umeki", value: 1 },
                      { name: "Olivia de Havilland", value: 2 }
                    ]
                  },
                  {
                    name: "India", value: 2, children: [
                      { name: "Julie Christie", value: 1 },
                      { name: "Vivien Leigh", value: 1 }
                    ]
                  },
                  {
                    name: "Cambodia", value: 1, children: [
                      { name: "Haing S. Ngor", value: 1 }
                    ]
                  },
                  {
                    name: "Israel", value: 1, children: [
                      { name: "Natalie Portman", value: 1 }
                    ]
                  },
                  {
                    name: "Malaysia", value: 1, children: [
                      { name: "Michelle Yeoh", value: 1 }
                    ]
                  },
                  {
                    name: "South Korea", value: 1, children: [
                      { name: "Youn Yuh-jung", value: 1 }
                    ]
                  }
                ]
              },
              {
                name: "Oceania", value: 3, children: [
                  {
                    name: "Australia", value: 2, children: [
                      { name: "Geoffrey Rush", value: 1 },
                      { name: "Heath Ledger", value: 1 }
                    ]
                  },
                  {
                    name: "New Zealand", value: 1, children: [
                      { name: "Russell Crowe", value: 1 }
                    ]
                  }
                ]
              },
              {
                name: "Africa", value: 1, children: [
                  {
                    name: "South Africa", value: 1, children: [
                      { name: "Charlize Theron", value: 1 }
                    ]
                  }
                ]
              }
            ]
          }
        ];
        // create a sunburst chart and set the data
        var chart = anychart.sunburst(data, "as-tree");
        // set the chart title
        chart.title("Non-U.S. Born Oscar Winners for Acting");
        // set the container id
        chart.container("container");
        // initiate drawing the chart
        chart.draw();
      });
    </script>
  </body>
</html>
Customizing JS Sunburst Chart
Congratulations on creating a fabulous sunburst chart using JavaScript! But why stop there when we can take it to the next level of coolness and interactivity? Brace yourself for some exciting and fun ideas to elevate your visualization even further. Let’s dive into these cool enhancements and make this diagram shine like never before!
1. Enhance the tooltip
Currently, when we hover over an entity in the sunburst chart, the tooltip only displays its name. But let’s take it up a notch and make the tooltip more informative. We’ll format it to show not only the name of the entity but also the total number of Oscars received by actors and actresses, countries, and continents at each level.
chart.tooltip().useHtml(true);
chart.tooltip().format("<h5 style='font-size:14px; font-weight:400; margin: 0.25rem 0;'>{%name}</h5><h5 style='font-size:12px; font-weight:400; margin: 0.25rem 0;'>Total Oscars: {%value}</h5");
With this enhancement, the tooltip will provide a comprehensive overview of the accolades garnered by various entities in the chart.
2. Enhance the coloring
Adding a personal touch to your work is always a great idea, and one way to do that is by playing with colors. Let’s take our sunburst chart to the next level by setting a custom color palette.
To achieve this, we’ll use the palette() function and pass an array of color codes that we desire for our chart. By selecting an appropriate color scheme, we can create a visually appealing and harmonious chart that suits our style.
chart.palette(['#345E80', '#00838F', '#00BFA5', '#ff6e40', '#d4e157', '#64B5F6']);Feel free to experiment with different color combinations and unleash your creativity.
3. Set the parent-dependent calculation mode
Gain even more insightful visualizations from our JS-based sunburst chart, let’s change the calculation mode to ‘parent-dependent’ by using the calculationMode() function to compare the levels of data based on their values.
With this adjustment, the size of each segment in the chart corresponds to the values it represents. In our current view, Europe, having the highest number of Oscar-winning actors and actresses born outside the U.S., takes the spotlight as the largest segment.
chart.calculationMode("parent-dependent");
4. Customize the labels
Now, let’s give our chart a clean and organized look by configuring the labels. We want to ensure that the information displayed is easily readable and visually appealing.
We can start by focusing on the top-level center of our sunburst chart. It’s an opportunity to add text that captures the essence of your data. Additionally, we have the flexibility to adjust various aspects of the label, such as the font color, size, weight, and so on.
// create and configure a label for the center content
let label = anychart.standalones.label();
label.text("Non-U.S. born");
label.width("100%");
label.height("100%");
label.fontColor("#64B5F6");
label.fontSize(12);
label.fontWeight(600);
label.hAlign("center");
label.vAlign("middle");
// set the center content
chart.center().content(label);
// set a space for the center content
chart.innerRadius(50);
// hide the world level
chart.level(0).thickness("0%");
Let’s also refine the label’s format and rotate the country names:
// configure the label format
chart.labels().format("{%name}");

// apply the radial position
chart.level(2).labels().position("radial");
5. Sort in ascending order
After all the customizations, we can further enhance the organization of the sunburst chart by setting the components in ascending order based on the total number of Oscars won at each level. This provides a clearer perspective on the distribution of Oscars across different levels.
chart.sort("asc");And voila! With these modifications, we have successfully created an interactive, fully-functional, and visually appealing JavaScript (HTML5) sunburst chart. It’s truly astonishing to see how a little bit of fun, creativity, and a few lines of code can result in such a remarkable visualization.
You can find the complete code, including all the customizations we’ve made, below. If you’re eager to experiment further with the chart, feel free to open it on the AnyChart Playground.
<!DOCTYPE html>
<html lang="en">
<head>
<meta charset="utf-8">
<title>JavaScript Sunburst Chart</title>
<script src="https://cdn.anychart.com/releases/8.11.1/js/anychart-core.min.js"></script>
<script src="https://cdn.anychart.com/releases/8.11.1/js/anychart-sunburst.min.js"></script>
<style type="text/css">
html, body, #container {
width: 100%;
height: 100%;
margin: 0;
padding: 0;
}
</style>
</head>
<body>
<div id="container"></div>
<script>
anychart.onDocumentReady(function(){
// create the data
var data = [
{
name: "World", value: 115, children: [
{
name: "Europe", value: 87, children: [
{
name: "England", value: 53, children: [
{ name: "Alec Guinness", value: 1 },
{ name: "Ben Kingsley", value: 1 },
{ name: "Charles Laughton", value: 2 },
{ name: "Colin Firth", value: 1 },
{ name: "Daniel Day-Lewis", value: 3 },
{ name: "Daniel Kaluuya", value: 1 },
{ name: "David Niven", value: 1 },
{ name: "Donald Crisp", value: 1 },
{ name: "Eddie Redmayne", value: 1 },
{ name: "Edmund Gwenn", value: 1 },
{ name: "Elizabeth Taylor", value: 2 },
{ name: "Emma Thompson", value: 1 },
{ name: "Gary Oldman", value: 1 },
{ name: "George Arliss", value: 2 },
{ name: "Glenda Jackson", value: 2 },
{ name: "Greer Garson", value: 1 },
{ name: "Helen Mirren", value: 1 },
{ name: "Jeremy Irons", value: 1 },
{ name: "Jessica Tandy", value: 1 },
{ name: "Jim Broadbent", value: 1 },
{ name: "John Gielgud", value: 1 },
{ name: "John Mills", value: 1 },
{ name: "Judi Dench", value: 1 },
{ name: "Julie Andrews", value: 1 },
{ name: "Kate Winslet", value: 1 },
{ name: "Laurence Olivier", value: 1 },
{ name: "Maggie Smith", value: 3 },
{ name: "Margaret Rutherford", value: 1 },
{ name: "Mark Rylance", value: 1 },
{ name: "Michael Caine", value: 2 },
{ name: "Olivia Colman", value: 1 },
{ name: "Paul Scofield", value: 1 },
{ name: "Peggy Ashcroft", value: 1 },
{ name: "Peter Finch", value: 1 },
{ name: "Peter Ustinov", value: 2 },
{ name: "Rachel Weisz", value: 1 },
{ name: "Rex Harrison", value: 1 },
{ name: "Robert Donat", value: 1 },
{ name: "Ronald Colman", value: 1 },
{ name: "Tilda Swinton", value: 1 },
{ name: "Vanessa Redgrave", value: 1 },
{ name: "Victor McLaglen", value: 1 },
{ name: "Wendy Hiller", value: 1 }
]
},
{
name: "Austria", value: 3, children: [
{ name: "Christoph Waltz", value: 1 },
{ name: "Joseph Schildkraut", value: 1 },
{ name: "Maximillian Schell", value: 1 }
]
},
{
name: "Wales", value: 6, children: [
{ name: "Ray Milland", value: 1 },
{ name: "Hugh Griffith", value: 1 },
{ name: "Catherine Zeta-Jones", value: 2 },
{ name: "Anthony Hopkins", value: 2 }
]
},
{
name: "France", value: 4, children: [
{ name: "Claudette Colbert", value: 1 },
{ name: "Jean Dujardin", value: 1 },
{ name: "Juliette Binoche", value: 1 },
{ name: "Marion Cotillard", value: 1 }
]
},
{
name: "Italy", value: 3, children: [
{ name: "Anna Magnani", value: 1 },
{ name: "Roberto Benigni", value: 1 },
{ name: "Sophia Loren", value: 1 }
]
},
{
name: "Russia", value: 3, children: [
{ name: "George Sanders", value: 1 },
{ name: "Lila Kedrova", value: 1 },
{ name: "Yul Brynner", value: 1 }
]
},
{
name: "Germany", value: 2, children: [
{ name: "Luise Rainier", value: 1 },
{ name: "Simone Signoret", value: 1 }
]
},
{
name: "Ireland", value: 2, children: [
{ name: "Barry Fitzgerald", value: 1 },
{ name: "Brenda Flicker", value: 1 }
]
},
{
name: "Spain", value: 2, children: [
{ name: "Javier Bardem", value: 1 },
{ name: "Penélope Cruz", value: 1 }
]
},
{
name: "Sweden", value: 2, children: [
{ name: "Alicia Vikander", value: 1 },
{ name: "Ingrid Bergman", value: 1 }
]
},
{
name: "Belgium", value: 1, children: [
{ name: "Audrey Hepburn", value: 1 }
]
},
{
name: "Greece", value: 1, children: [
{ name: "Katina Paxinou", value: 1 }
]
},
{
name: "Hungary", value: 1, children: [
{ name: "Paul Lukas", value: 1 }
]
},
{
name: "Romania", value: 1, children: [
{ name: "John Houseman", value: 1 }
]
},
{
name: "Scotland", value: 1, children: [
{ name: "Sean Connery", value: 1 }
]
},
{
name: "Switzerland", value: 1, children: [
{ name: "Emil Jannings", value: 1 }
]
},
{
name: "Ukraine", value: 1, children: [
{ name: "Paul Muni", value: 1 }
]
}
]
},
{
name: "America", value: 14, children: [
{
name: "Canada", value: 11, children: [
{ name: "Anna Paquin", value: 1 },
{ name: "Christopher Plumme", value: 2 },
{ name: "Harold Russell", value: 1 },
{ name: "Marie Dressler", value: 2 },
{ name: "Mary Pickford", value: 2 },
{ name: "Norma Shearer", value: 2 },
{ name: "Walter Huston", value: 1 }
]
},
{
name: "Mexico", value: 3, children: [
{ name: "Anthony Quinn", value: 2 },
{ name: "Lupita Nyong’o", value: 1 }
]
}
]
},
{
name: "Asia", value: 10, children: [
{
name: "Japan", value: 4, children: [
{ name: "Joan Fontaine", value: 1 },
{ name: "Miyoshi Umeki", value: 1 },
{ name: "Olivia de Havilland", value: 2 }
]
},
{
name: "India", value: 2, children: [
{ name: "Julie Christie", value: 1 },
{ name: "Vivien Leigh", value: 1 }
]
},
{
name: "Cambodia", value: 1, children: [
{ name: "Haing S. Ngor", value: 1 }
]
},
{
name: "Israel", value: 1, children: [
{ name: "Natalie Portman", value: 1 }
]
},
{
name: "Malaysia", value: 1, children: [
{ name: "Michelle Yeoh", value: 1 }
]
},
{
name: "South Korea", value: 1, children: [
{ name: "Youn Yuh-jung", value: 1 }
]
}
]
},
{
name: "Oceania", value: 3, children: [
{
name: "Australia", value: 2, children: [
{ name: "Geoffrey Rush", value: 1 },
{ name: "Heath Ledger", value: 1 }
]
},
{
name: "New Zealand", value: 1, children: [
{ name: "Russell Crowe", value: 1 }
]
}
]
},
{
name: "Africa", value: 1, children: [
{
name: "South Africa", value: 1, children: [
{ name: "Charlize Theron", value: 1 }
]
}
]
}
]
}
];
// create a sunburst chart and set the data
var chart = anychart.sunburst(data, "as-tree");
// set the chart title
chart.title("Non-U.S. Born Oscar Winners for Acting");
// format the tooltip
chart.tooltip().useHtml(true);
chart.tooltip().format("<h5 style='font-size:14px; font-weight:400; margin: 0.25rem 0;'>{%name}</h5><h5 style='font-size:12px; font-weight:400; margin: 0.25rem 0;'>Total Oscars: {%value}</h5");
// set a custom palette
chart.palette(['#345E80', '#00838F', '#00BFA5', '#ff6e40', '#d4e157', '#64B5F6']);
// set the parent-dependent calculation mode
chart.calculationMode("parent-dependent");
// create and configure a label for the center content
let label = anychart.standalones.label();
label.text("Non-U.S. born");
label.width("100%");
label.height("100%");
label.fontColor("#64B5F6");
label.fontSize(12);
label.fontWeight(600);
label.hAlign("center");
label.vAlign("middle");
// set the center content
chart.center().content(label);
// set a space for the center content
chart.innerRadius(50);
// hide the world level
chart.level(0).thickness("0%");
// configure the label format
chart.labels().format("{%name}");
// apply the radial position
chart.level(2).labels().position("radial");
// set the ascending order
chart.sort("asc");
// set the container id
chart.container("container");
// initiate drawing the chart
chart.draw();
});
</script>
</body>
</html>Conclusion
I hope you’ve enjoyed the journey of creating a mesmerizing sunburst diagram. Continue learning with the sunburst chart documentation, and check out the gallery of sunburst chart examples for inspiration.
Now that you’ve acquired the skills to craft such stunning visualizations, it’s time to let your creativity soar. Don’t be afraid to venture into uncharted territories, explore different chart types, and push the boundaries of what’s possible.
If you have any questions or need further assistance, don’t hesitate to reach out. I’m here to support you on your learning journey. Now, go forth and create captivating visualizations that will captivate your audience.
Happy charting and happy learning!
A big thank you to Awan Shrestha for creating this fantastic Sunburst Chart tutorial exclusively for our blog!
Don’t miss out on other JavaScript charting tutorials on our blog!
If you have an idea for a nice guest post, let’s discuss it!
- Categories: AnyChart Charting Component, Big Data, HTML5, JavaScript, JavaScript Chart Tutorials, Tips and Tricks
- No Comments »