Qlik Extension: Introducing Configuration File Settings for Charts
December 20th, 2018 by Irina Maximova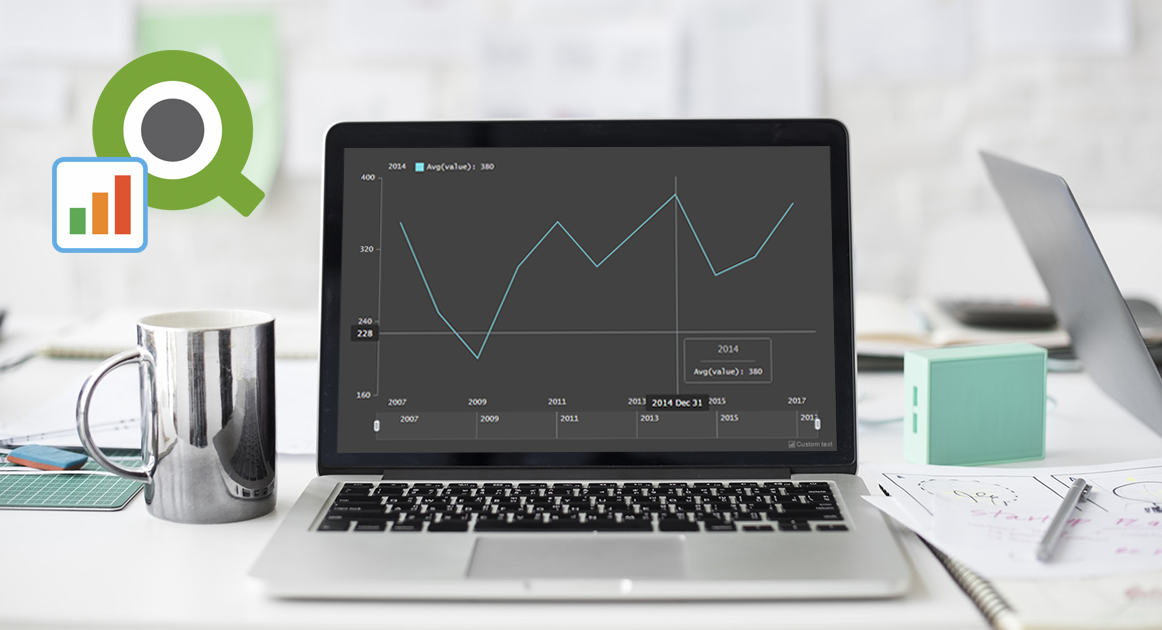 Another brand new AnyChart Qlik plugin feature has arrived: Now it is possible to change the default settings in the configuration file of our Qlik extension for data visualization!
AnyChart Qlik plugin’s configuration file allows you to apply the default settings to all charts and dashboards created by the extension and customize them, which is impossible to achieve in the chart editor itself.
- Categories: Big Data, HTML5, News, Qlik, Tips and Tricks
- 2 Comments »
Qlik Extension Gets Gantt Chart and Tag Cloud in Version 2.5.0
November 6th, 2018 by AnyChart Team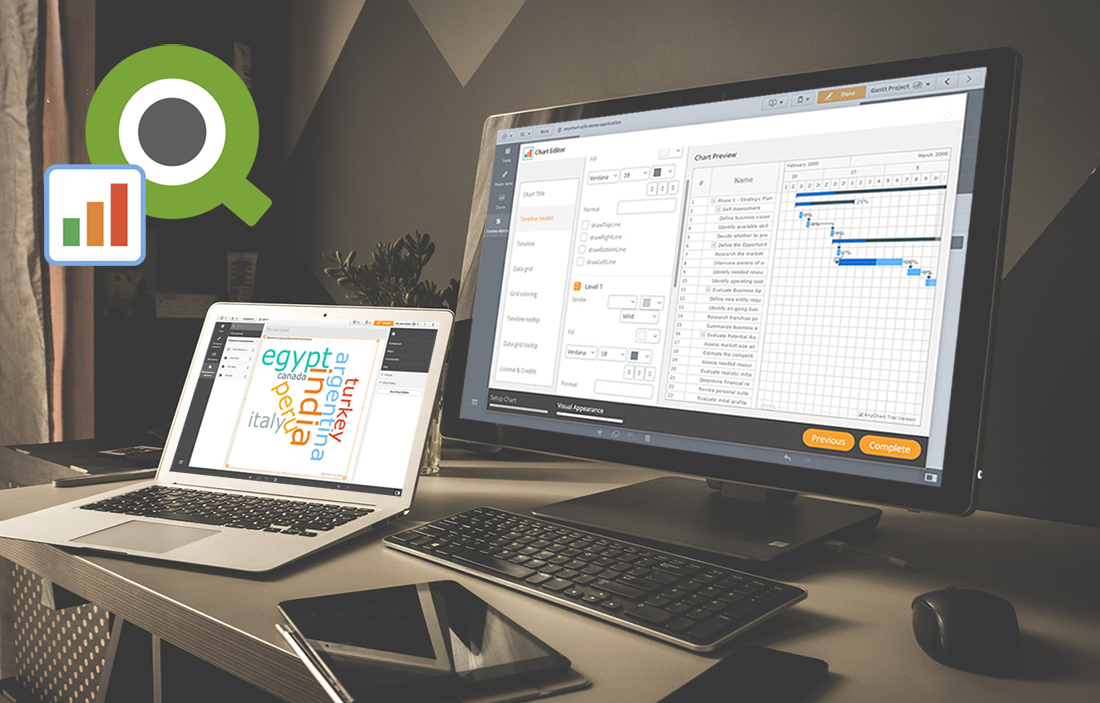 Following the 8.4.0 release of the AnyChart JS Charts library, now we’ve also got an awesome major update for our data visualization extension for Qlik Sense. Its version 2.5.0 is already available, adding Gantt Chart and Tag Cloud to the list of supported chart types.
Meet AnyChart Qlik Extension 2.5.0!
- Categories: AnyChart Charting Component, Qlik
- No Comments »
Qlik Charts Updated to Version 2.4.0, Now with Multiple Scales, Localizations, and More
June 14th, 2018 by AnyChart Team Great news for Qlik users! We’ve released version 2.4.0 of the AnyChart Qlik Extension. The latest update brings several important new features to Qlik charts: multiple scales, localization support, coloring controls for OHLC, candlestick and waterfall charts, as well as label rotation settings.
Learn more about the new version of our JavaScript (HTML5) charting library extension for interactive data visualization on Qlik data analytics platform, and what’s next in our plans.
- Categories: AnyChart Charting Component, HTML5, JavaScript, News, Qlik
- No Comments »
AnyChart Qlik Sense Extension 2.3.0 Released Featuring Linear and Circular Gauges
March 8th, 2018 by AnyChart Team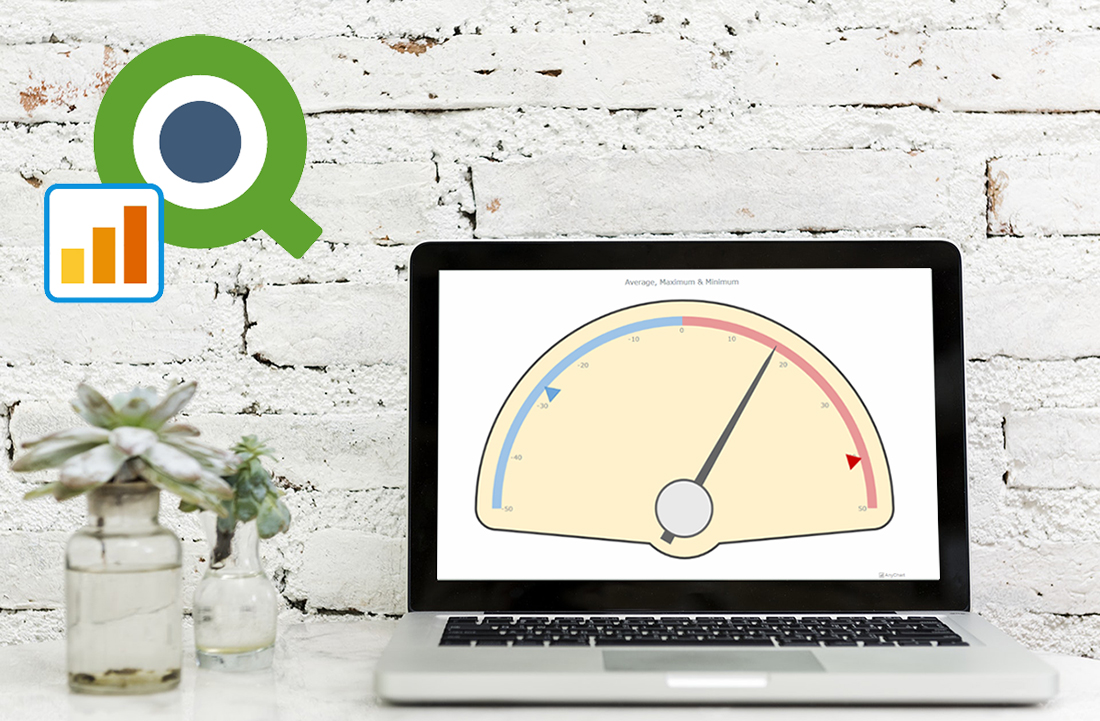 Less than four months have passed since we presented version 2.0 of our Qlik Sense extension for advanced data visualization. During that short time period, we released three more updates: 2.0.1, 2.1.0 and 2.2.0. And here’s a new one ready!
The latest update adds two new chart types – Linear and Circular Gauges – as well as several new important features, further extending the power of our JavaScript charting libraries to the Qlik Sense environment. Check out the details in a quick overview below.
- Categories: AnyChart Charting Component, HTML5, JavaScript, News, Qlik
- No Comments »